
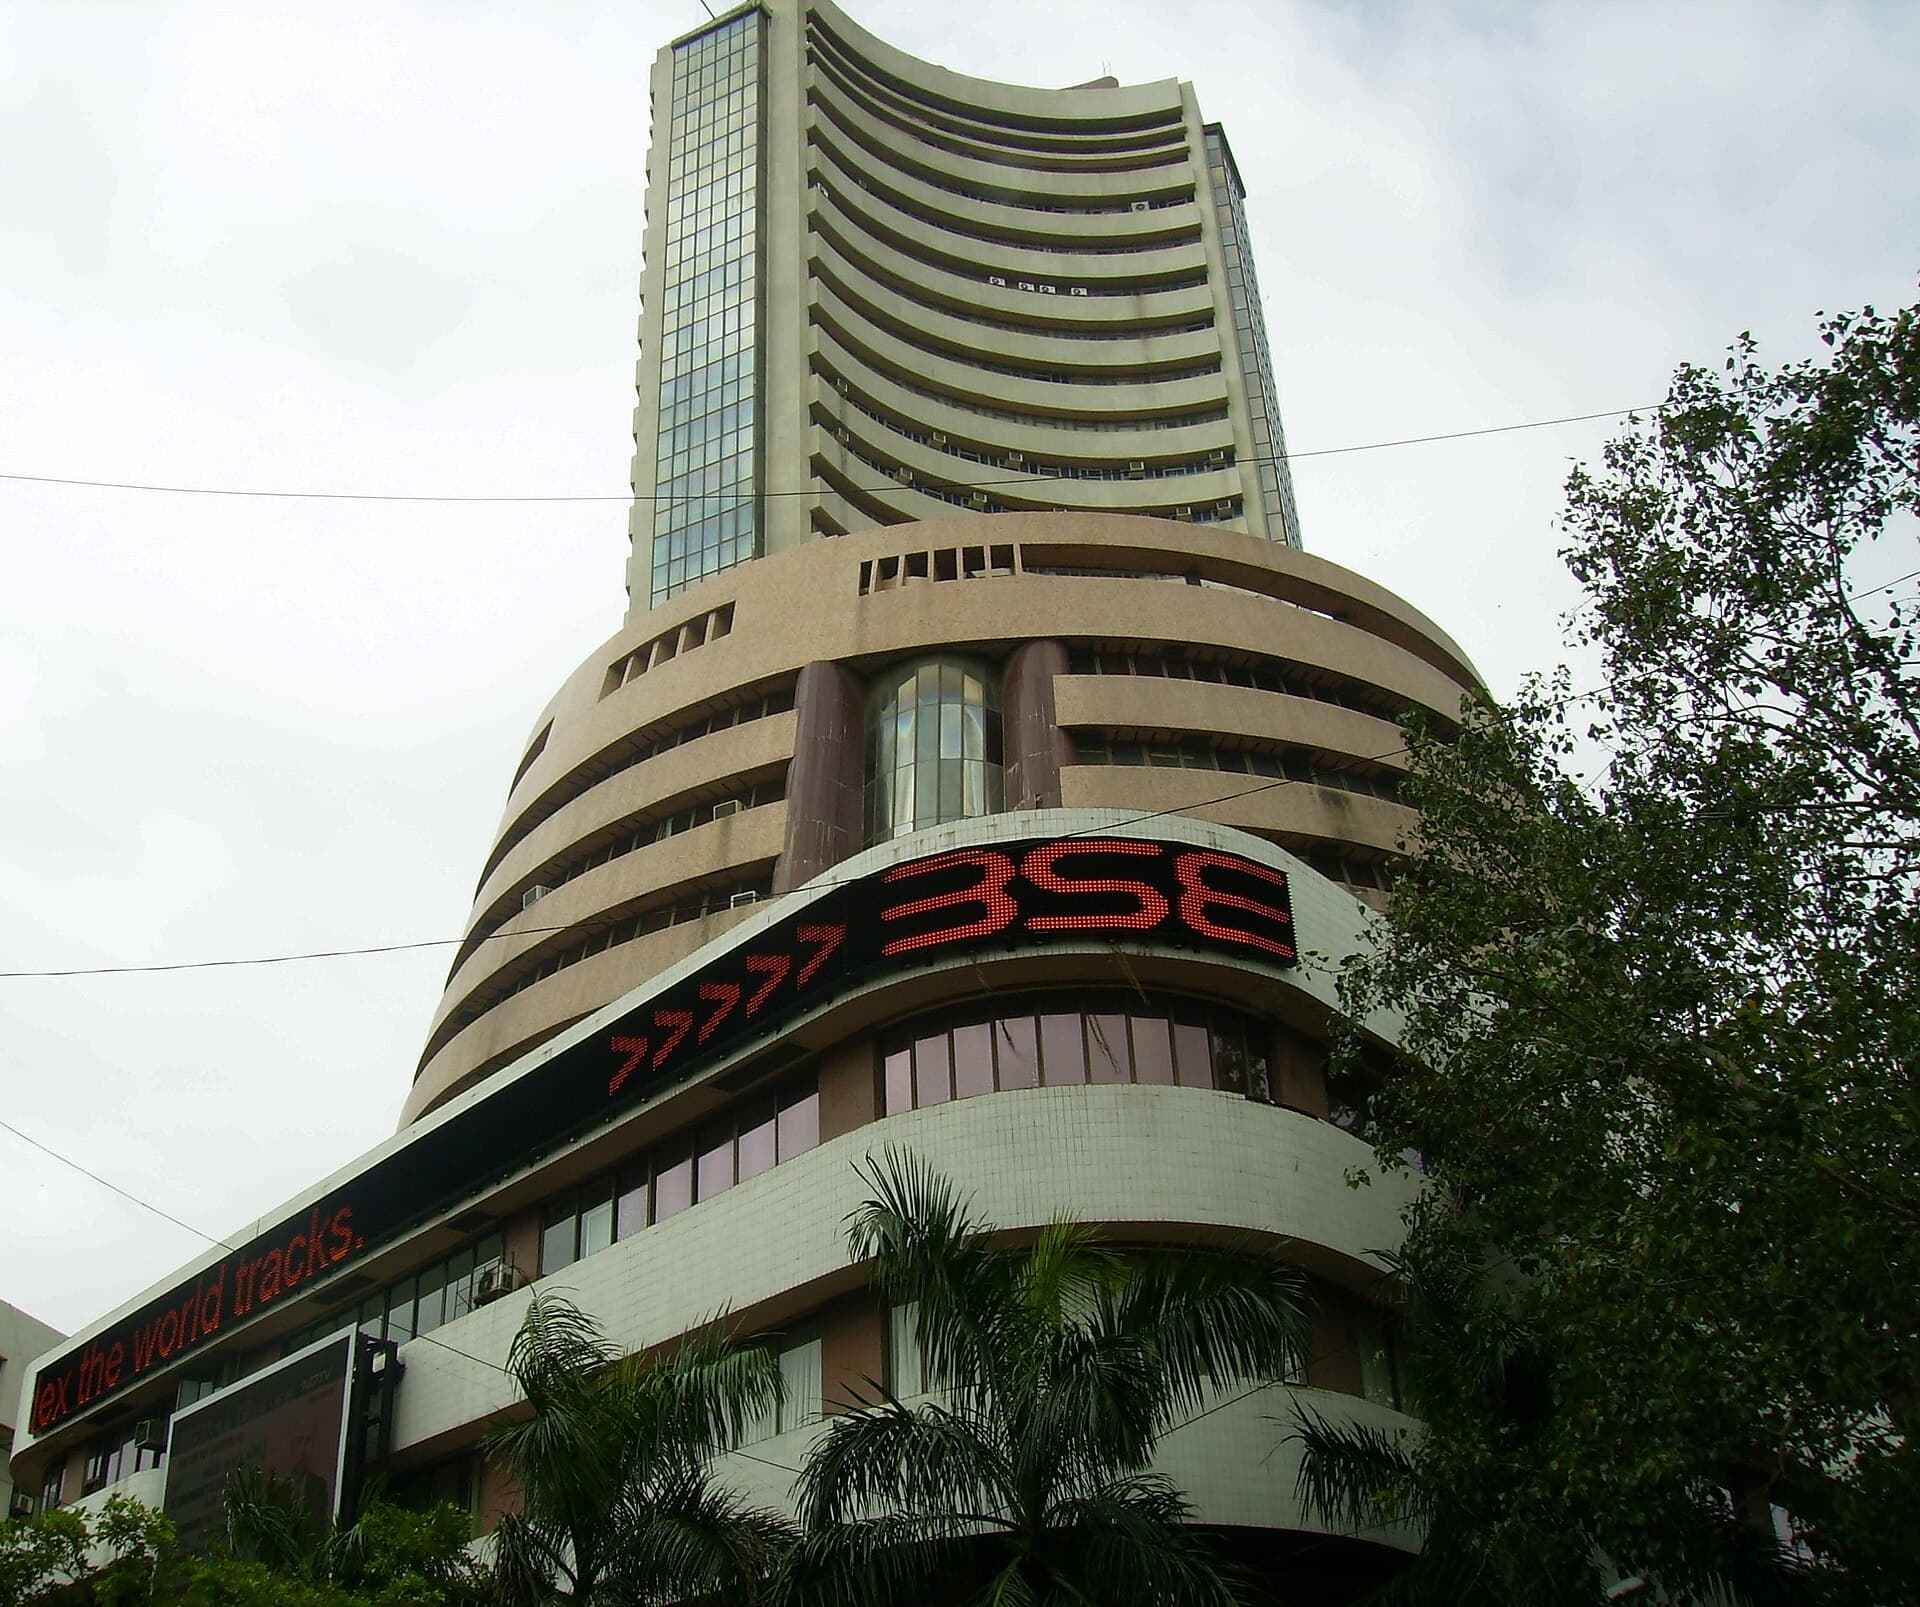
In April 1992, a 42-year-old stockbroker named Harshad Mehta was arrested. The Sensex, which had run up nearly 270% in two years on the back of his bank receipt scam, began a collapse that would drag on for 12 months and erase 54% of market value. Sixteen years later, a bank in Manhattan filed for bankruptcy on a Sunday night. By the time Indian markets opened on Monday, September 15, 2008, the Sensex was already processing a crash that would take another 14 months to bottom out — down 61% from its January 2008 peak of 20,873.
Two crashes. Two completely different origin stories. One nearly identical outcome for the retail investor sitting in Mumbai, Ahmedabad, or Kanpur holding mutual fund units or broker-bought shares.
The 1992 Crash Was Made in India
The Harshad Mehta scam was a domestic creation — a product of regulatory gaps, weak banking oversight, and a newly liberalised market that nobody quite knew how to police yet.
Mehta exploited the inter-bank securities settlement system. Banks were lending him money against forged bank receipts (BRs), which he then pumped into the stock market. The beneficiary was the Sensex — it hit 4,467 in April 1992, up from around 1,200 in early 1990. ACC's stock went from ₹200 to ₹9,000 in less than a year. Retail investors, newly drawn to equities after liberalisation, followed the momentum without understanding what was underneath it.
SEBI had been given statutory powers only in 1992 — the same year the scam broke. It was essentially a newborn regulator trying to contain a fire it hadn't been built to prevent. The RBI, once the scam surfaced, moved to tighten bank exposure to capital markets. Credit disappeared fast. The Sensex fell in a slow, grinding, 12-month bleed — not a single dramatic day but a persistent, demoralising retreat.
The 2008 Crash Was Imported
If 1992 was a homegrown disaster, 2008 was contagion. India's domestic fundamentals in late 2007 and early 2008 were not broken. GDP growth was around 9%. Corporate earnings were solid. But Indian markets had attracted massive foreign institutional investor (FII) money during the 2003–2007 bull run, and when global credit froze, FIIs needed cash. They sold whatever they could, wherever they could.
In 2008, FIIs pulled out approximately ₹53,000 crore from Indian equities — the largest outflow recorded up to that point. The Sensex, which had touched 20,873 on January 8, 2008, fell to 7,697 by October 27, 2008 — its intraday low. That's a 63% drawdown from peak to trough intraday, settling around 61% on a closing basis over the full 14-month fall.
Indian banks didn't hold toxic mortgage securities in the way American or European banks did. ICICI Bank faced some questions about its international exposure, and its stock fell over 75% from peak to trough, but the fear was more contagion than reality. The crash was real, but it was caused by global deleveraging, not Indian dysfunction.
What Retail Investors Actually Did
Here's where the two crashes converge in the most painful way.
After 1992, retail participation in Indian equity markets collapsed. Investors who had trusted the system — many for the first time after liberalisation — felt cheated. Retail ownership of BSE-listed stocks dropped from roughly 30% in 1992 to just 8% by 1995. That's not panic selling — that's a structural exit. People didn't come back for years.
The Sensex didn't make a new all-time high until 1999 — seven years after the 1992 peak. Seven years. An investor who bought at the top in April 1992 was underwater until the Kargil era.
After 2008, the pattern repeated. Retail participation fell from around 19% in 2007–08 to roughly 11% by 2012. SIP inflows, which had been growing steadily, stagnated. The confidence that had been built through the 2003–2007 bull market — where a ₹1 lakh investment in a good diversified equity fund became ₹3–4 lakh — evaporated. The Sensex recovered faster this time, making new highs around 2013, five years after the 2008 peak. But many retail investors had already exited and missed the recovery entirely.
This is the real cost of a crash — not the paper losses at the bottom, but the years of compounding foregone by investors who left and didn't return.
Different Villains, Same Aftermath
The 1992 scam had a face — Harshad Mehta became the story. The anger had a target. SEBI overhauled its entire framework in response. Badla trading was eventually abolished. The National Stock Exchange launched in 1994, bringing transparency through electronic order matching. The crash reshaped Indian market infrastructure in ways that were, over time, genuinely beneficial.
2008 had no single Indian villain. Lehman Brothers was the face, but it was an abstract American institution. The anger was diffuse. SEBI introduced circuit breakers that had already existed but reinforced position limits, tightened P-note regulations, and pushed for better mutual fund disclosures. But there was no cathartic regulatory moment. The lesson for retail investors was harder to digest: sometimes markets fall because of things happening 12,000 kilometres away, and there's nothing anyone can do about it.
That diffuse blame may have actually made 2008 psychologically harder to process. In 1992, you could blame Mehta, blame the banks, blame SEBI. In 2008, you could only blame the interconnected nature of capital — which is an unsatisfying enemy.
The Arithmetic of Sitting Still
Both crashes produced massive numbers of investors who sold near the bottom and bought back near the next top — the worst possible trade sequence.
A ₹1 lakh investment in a Nifty index equivalent in early 1992 was worth roughly ₹46,000 at the 1993 bottom. If the investor sold there and returned in 1996, they'd be buying back at almost the same price they sold. If they had held through to 1999, their original ₹1 lakh was worth closer to ₹1.6–1.8 lakh.
The 2008 version: a ₹1 lakh investment at the January 2008 Sensex peak was worth around ₹39,000 at the October 2008 low. An investor who held through to 2013 was back above breakeven. An investor who sold in October 2008 and returned in 2010 when "things looked safer" locked in losses and missed most of the recovery.
Both scenarios punish the same behaviour: reacting to fear with action.
What to Do Before the Next One
The next crash is not a question of if. The specific trigger — another domestic fraud, another global credit event, a geopolitical shock, an AI-driven liquidity crisis — is unknowable. The contours are not.
A few things that held across both 1992 and 2008:
- The investors who came in with a clear target allocation and didn't exceed it suffered less psychological damage, even if the portfolio pain was identical.
- The investors who kept buying SIPs through both crashes — even if they reduced the amount — ended up significantly better off than those who stopped.
- Debt funds and gold both held value better during 2008 than equities; having even 20–30% in non-equity assets reduced the "I need to sell" impulse significantly.
- The regulatory framework after each crash became meaningfully stronger. India post-2008 is a better-regulated market than India post-1992. That doesn't prevent the next crash, but it does raise the floor.
The lesson isn't about predicting crashes. It's about building a portfolio and a mindset that doesn't require you to make a good decision in the worst possible moment. Both 1992 and 2008 asked investors that question. Most failed. The few who passed — who sat on their hands or kept investing mechanically — didn't look smart at the bottom. They looked reckless. But they captured the full recovery.
The next crash will feel different. The cause will be new. The panic will be identical. Decide now what you'll do then.