Charts
Charts you can trade from.
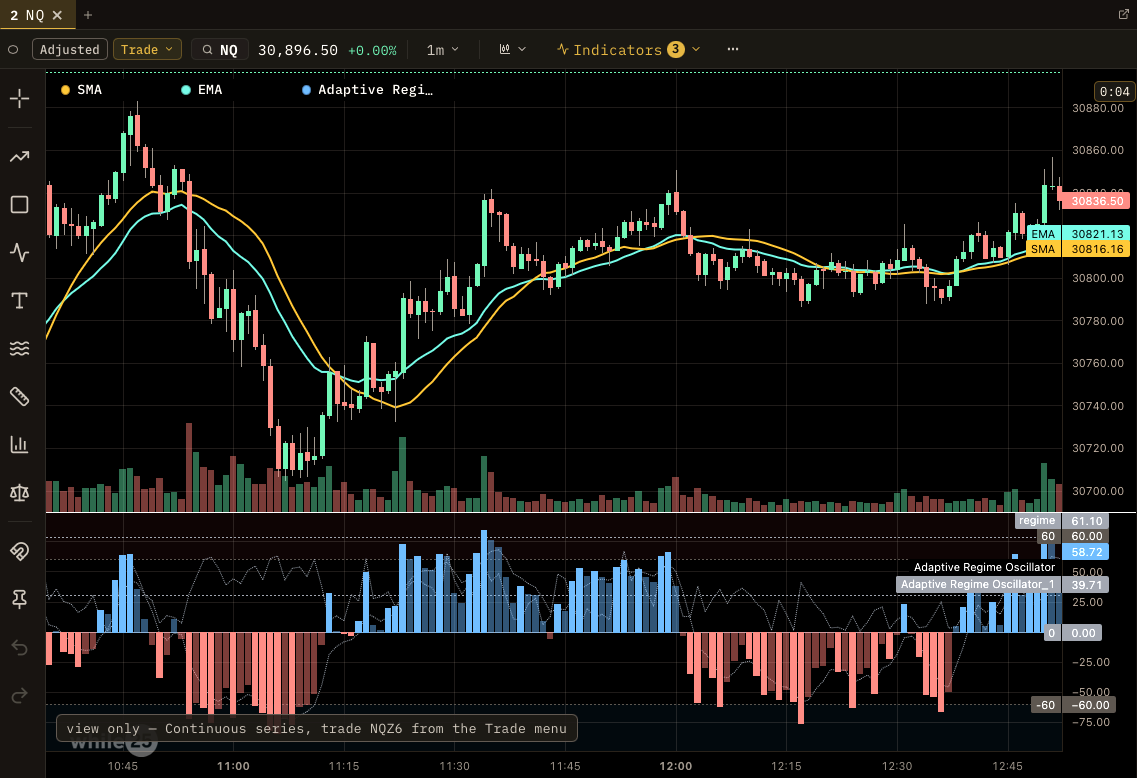
We give you all the standard indicators, a full set of drawing tools and several charts side by side. You place orders on the chart and add your own custom indicators next to the built-in ones.
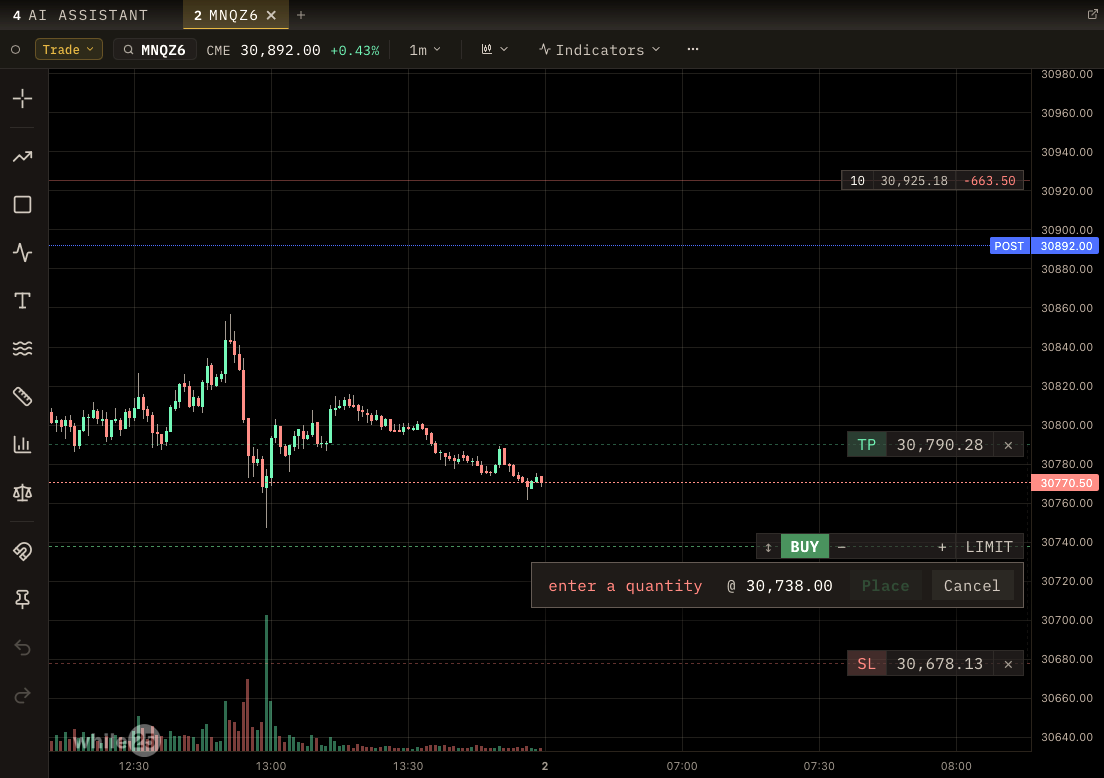
Trade on the chart.
You place an order on the chart and drag its line to change the price. Your take-profit and stop-loss appear as lines you can drag too.
Your custom indicators.
You build your own indicator, in Python or with the AI assistant, and we add it to the indicator list next to the built-in ones, with the same settings window.
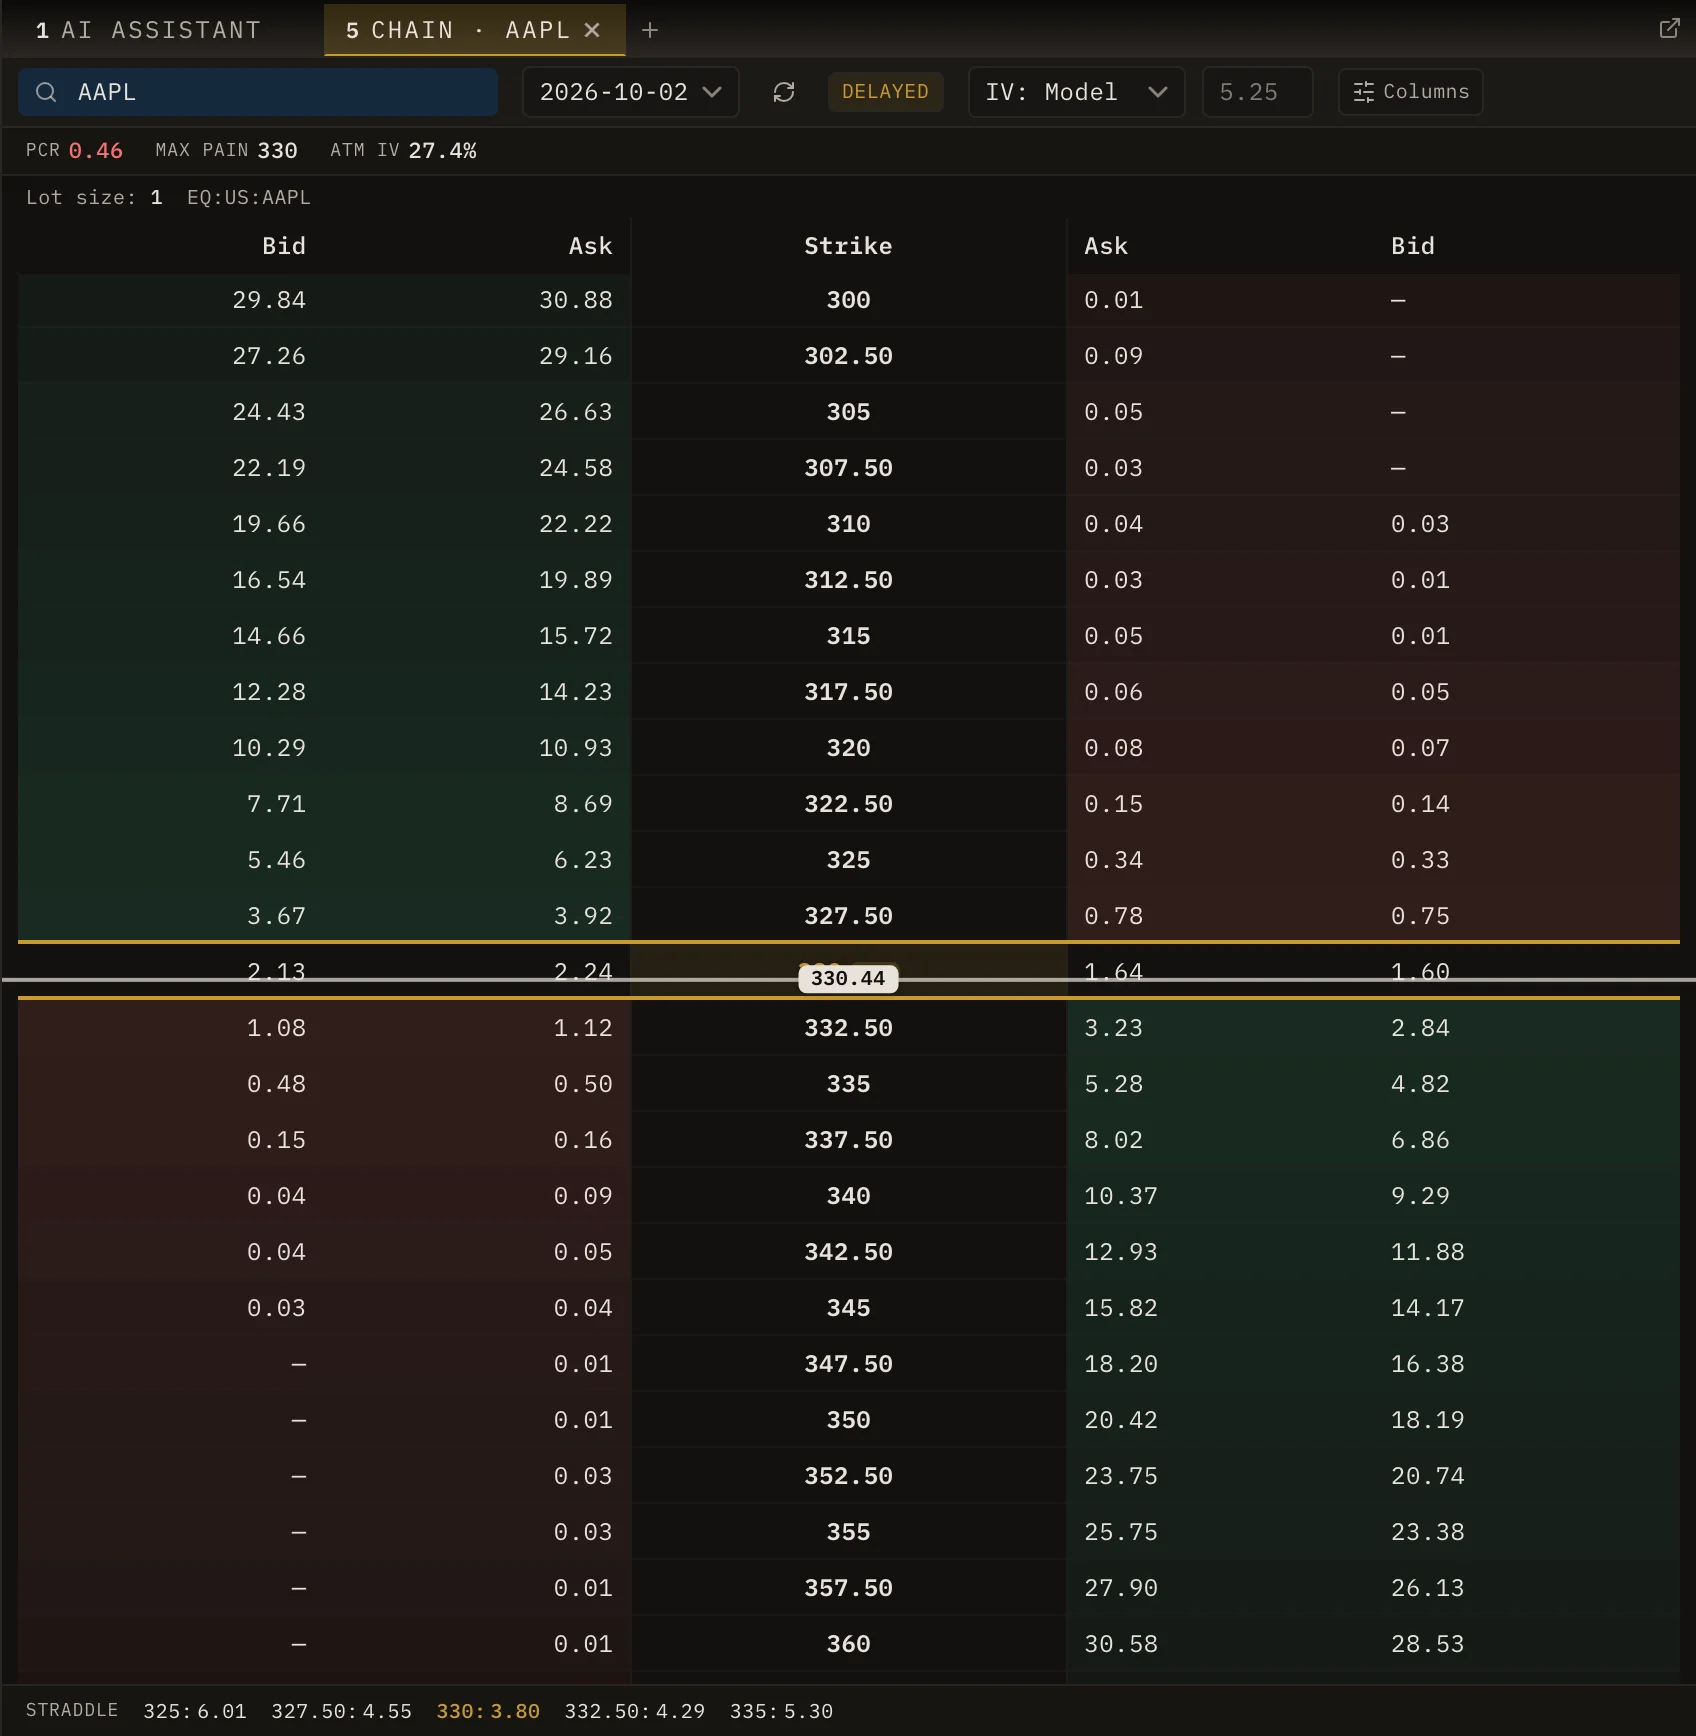
Options analytics.
You see the option chain next to the chart, with the put-call ratio, max pain, implied volatility and straddle prices.
What you get on the chart
All the standard indicators.
You get moving averages, RSI, MACD, Bollinger Bands, ATR, Supertrend, OBV, volume profile and more. We sort them into momentum, trend, volume and volatility.
A full set of drawing tools.
You draw trend lines, rays, channels, Fibonacci levels, shapes, text, chart patterns and measurements.
Several charts at once.
You put two, four or more charts side by side, each with its own symbol and timeframe.
Prices from the broker.
When your broker offers a live feed, we stream the chart from it, so the price on screen matches the price you trade at.