
General Motors shares fell 8.2% on October 20. A share is a small slice of ownership in a company. That same day, the carmaker reported a bigger profit than analysts expected. Analysts are professionals who study companies and forecast their results.
GM earned $3.70 a share in the third quarter, its latest three-month period. Its profit came to $3.70 for each share of the company. GM took in $50.0 billion in revenue, the money it earns from sales. The consensus is the average forecast of the analysts who follow a company. Their consensus for GM's revenue was $48.77 billion. Investors call a result above the consensus a beat.
In the same report, GM approved a share buyback of up to $20 billion. In a buyback, a company spends its own cash to buy its shares from investors on the stock market. Fewer shares remain, so each one represents a larger slice of the profit.
Investors pushed the wider market up that day. An index is a single number that tracks the share prices of a group of companies. Investors lifted the S&P 500, an index of large US companies, by 0.28%. They pushed the Dow Jones Industrial Average, another index, up 1.02%. On that rising day, GM beat forecasts for profit and revenue. It also announced a large buyback. Its shares dropped. GM's forecast for the rest of the year explains the drop.
Two kinds of numbers in one report
A company publishes an earnings report to show its results. Each report carries two sets of figures. The first set covers the quarter that ended. The second set is guidance. Guidance is the range of profit a company expects to earn over a coming period, such as the full year.
The quarter is history. GM has recorded that money, and the result will not change. GM's managers set the guidance as their estimate for the months ahead.
Investors base a share price on that second set. Owning a share means owning a slice of a company's profits for years to come. Investors set today's price from the profits they expect in those years. A strong quarter adds one good result to that picture. With a new full-year forecast, a company resets the path investors expect its profit to follow. Analysts carry that path into their estimates for later years.
Reading GM's forecast
GM reports a measure called adjusted EPS. EPS stands for earnings per share, and earnings means profit. It equals the company's profit divided by its number of shares. "Adjusted" means GM leaves out costs it treats as one-time items. The adjusted figure shows the business GM runs from year to year.
Before October 20, GM expected full-year adjusted EPS between $12.00 and $14.00. In the third-quarter report, GM narrowed that range to $12.75 to $13.75. It raised the floor, or bottom of the range. It lowered the ceiling, or top.
By narrowing the range, GM signaled more certainty. Investors focused on the middle of the range. The midpoint of GM's new range is $13.25. The analyst consensus for the year was $13.42. GM's own central estimate sat below the number in analysts' forecasts.
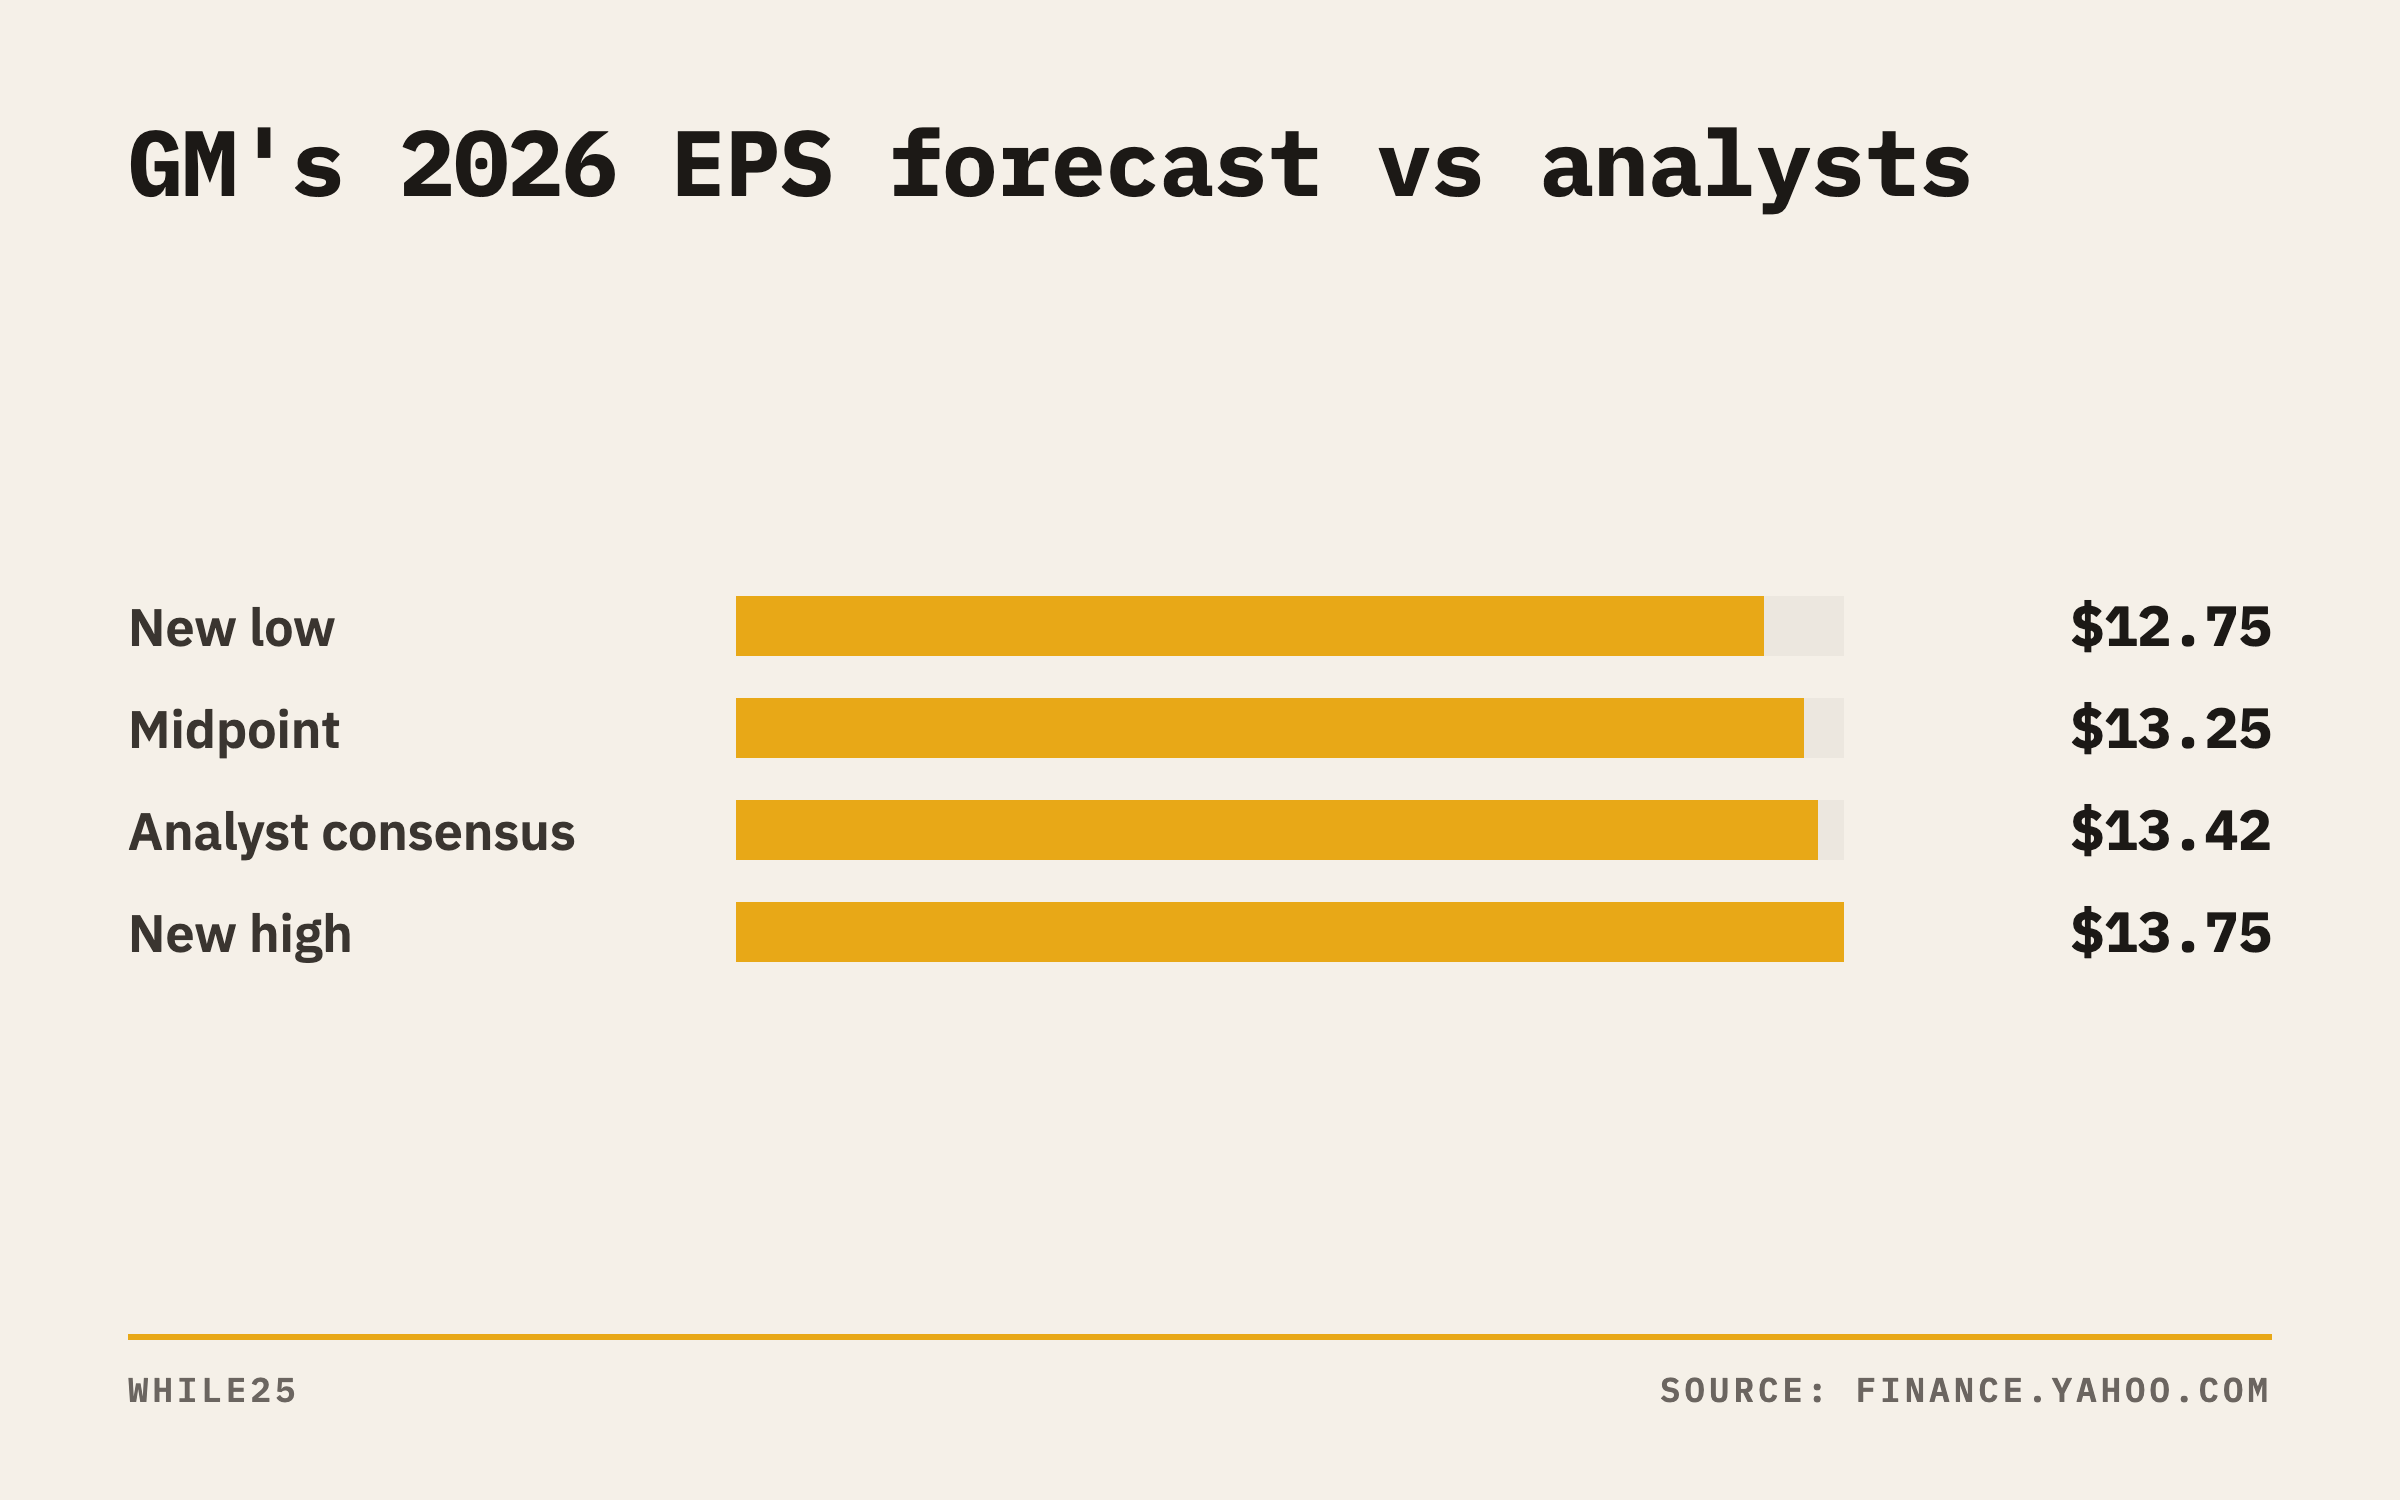 Bar chart: GM's new adjusted EPS guidance runs from $12.75 to $13.75, and its $13.25 midpoint sits below the $13.42 analyst consensus
Analysts read the midpoint
Analysts estimate a company's profit for the year. Investors use those estimates to judge what a share is worth. A company has a clearer view of its own orders, costs and factories than any outside analyst. If a company's forecast lands below the consensus, analysts take that as a sign their numbers may be too high.
Valuation here means how many times a share's yearly profit investors will pay for that share. If investors keep the same valuation, lower expected profit means a lower share price. On October 20, investors repriced GM shares to fit a smaller expected profit for the year.
Before the report, GM's range went as high as $14.00 a share in profit. Its new range tops out at $13.75. Some investors had priced the shares on a chance that GM would reach the high end. By lowering the ceiling, GM took away that chance.
GM made the same move with a second profit measure, adjusted EBIT. EBIT stands for earnings before interest and taxes. It measures the profit from running the business, before payments to lenders and the government. GM narrowed its full-year adjusted EBIT guidance to $14.5–$15.5 billion. The old range was $14.0–$16.0 billion. GM cut the top end from $16.0 billion to $15.5 billion.
GM raised its cash forecast
GM raised some of its other forecasts. Free cash flow is the cash a business has left after it pays its bills and invests in plants and equipment. GM lifted its forecast for adjusted automotive free cash flow to $11.5–$12.5 billion. The old range was $9.5–$11.5 billion. A company can spend free cash on buybacks, dividends or paying down debt. Dividends are cash payments a company makes to its shareholders.
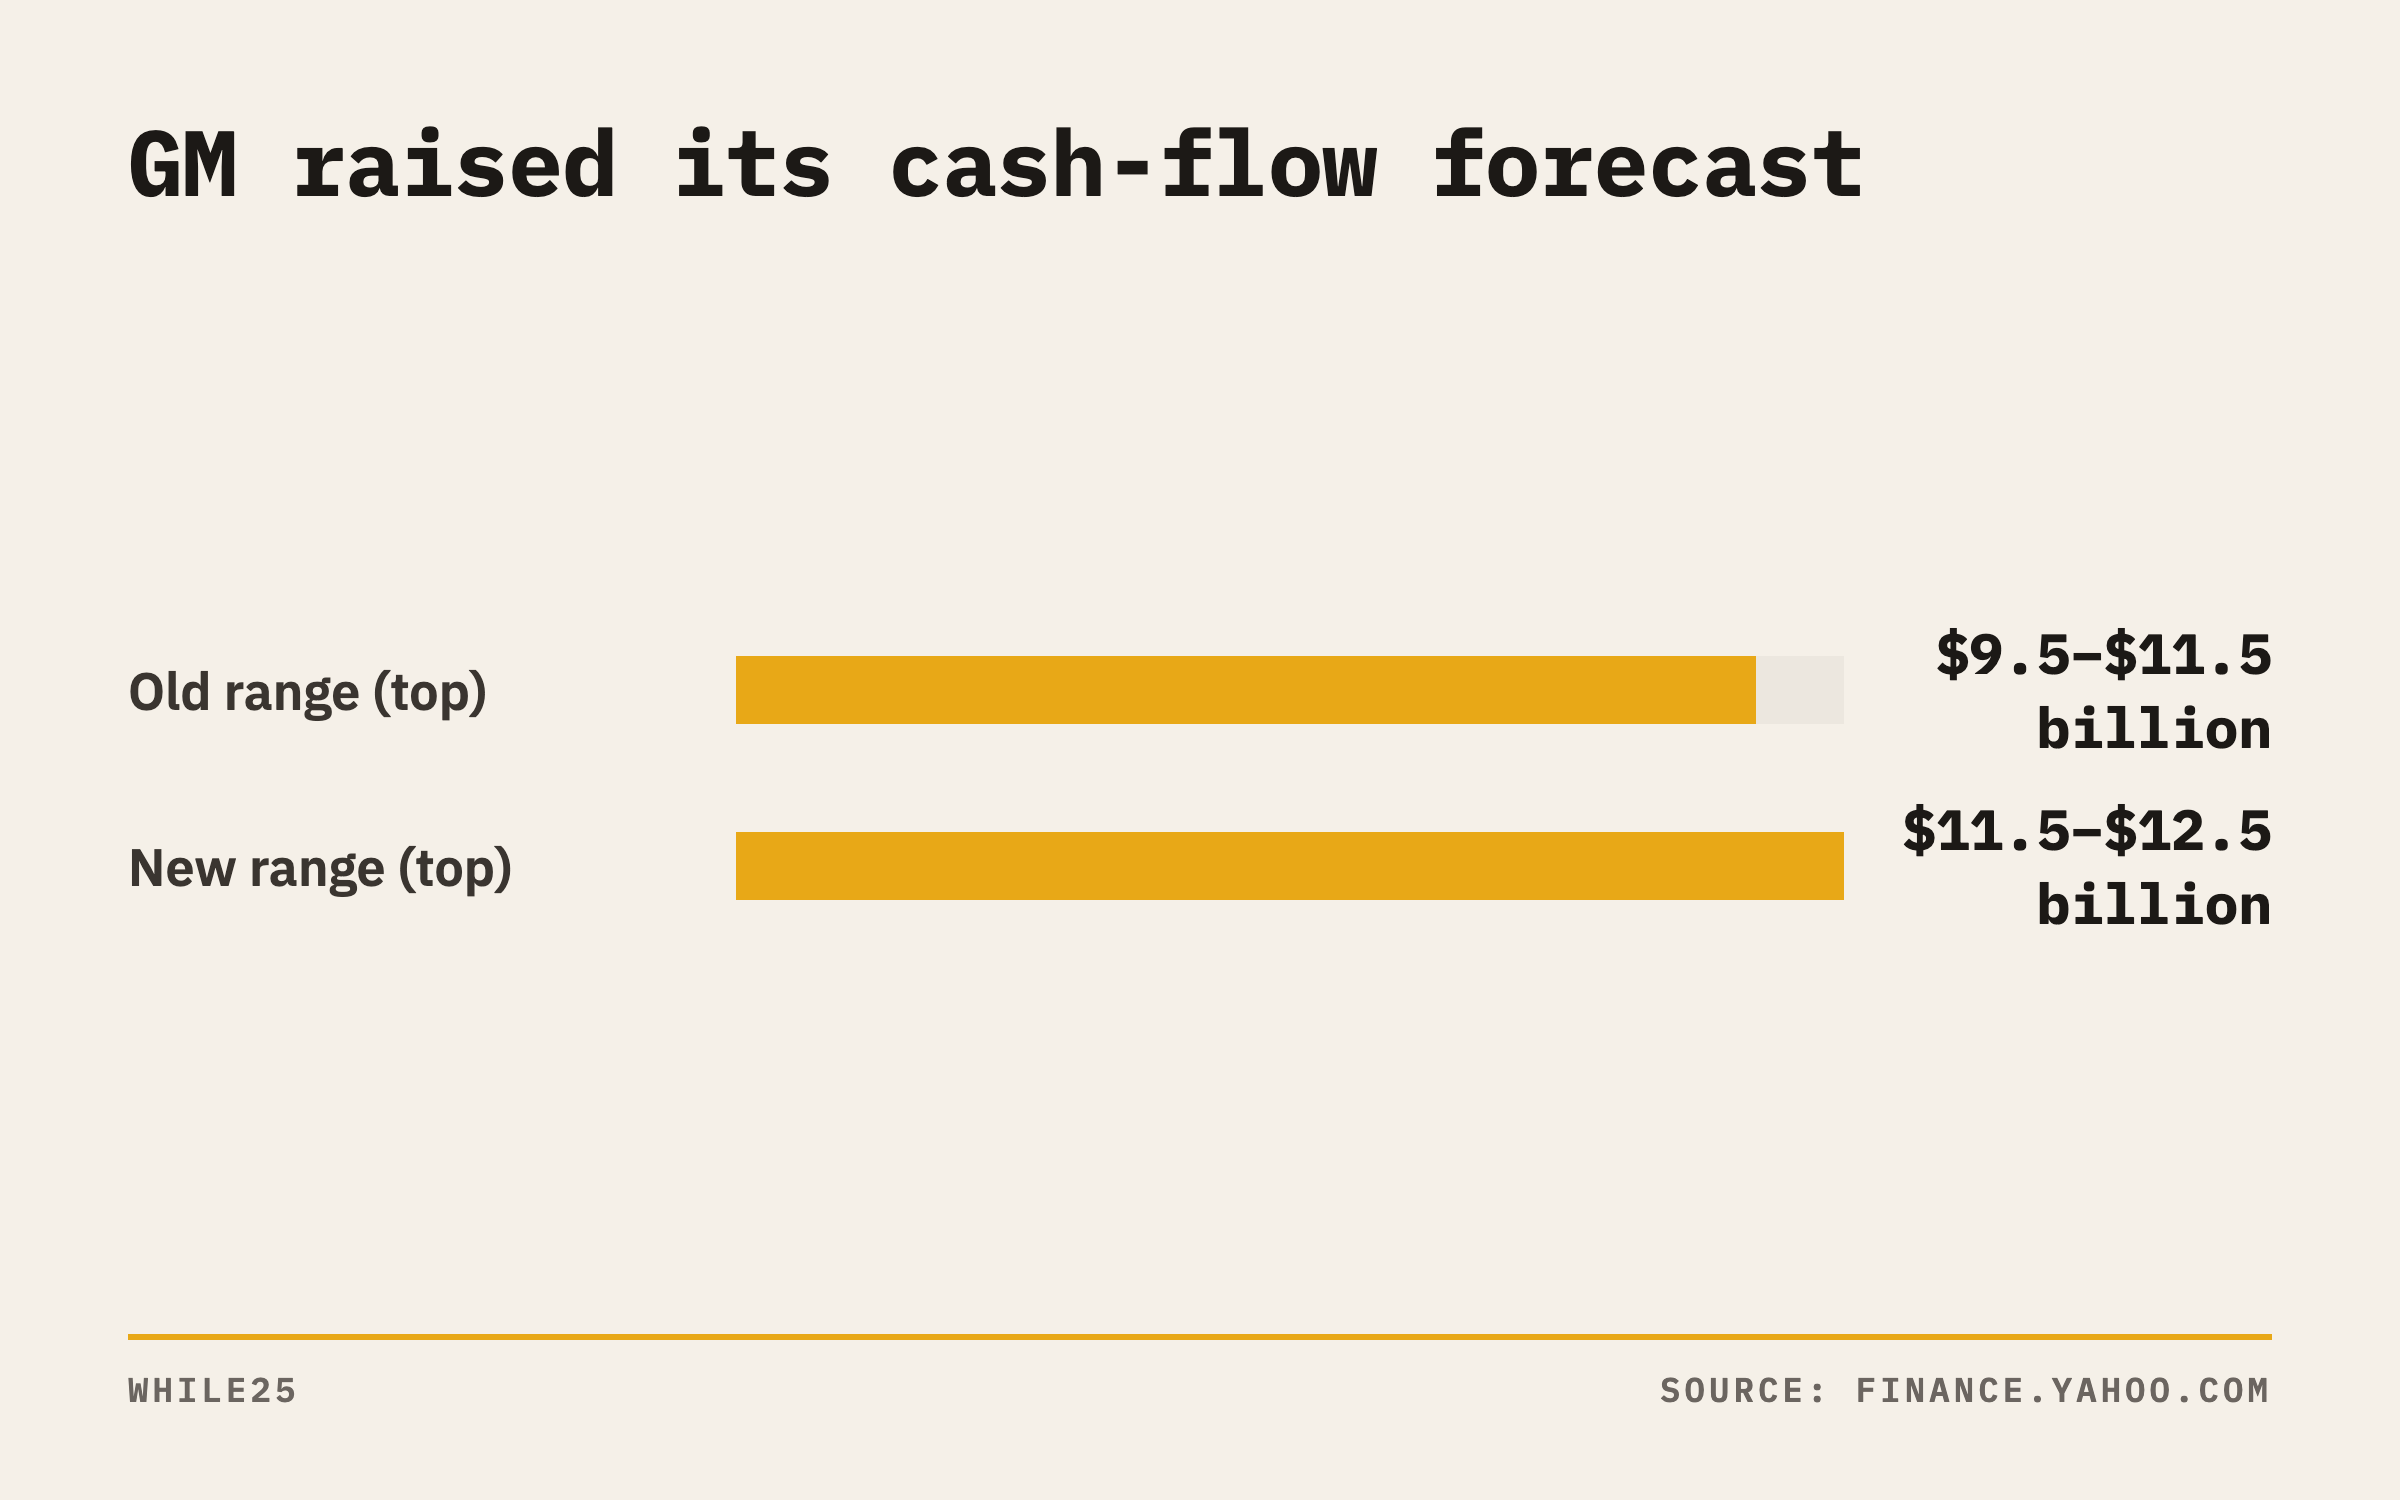 Bar chart: GM raised its adjusted automotive free cash flow guidance from $9.5–$11.5 billion to $11.5–$12.5 billion
GM set the new floor for cash flow where the old ceiling was. In the same report, GM laid out how it uses that cash. It completed a $6.0 billion buyback and approved the new $20.0 billion multi-year authorization. An authorization sets a cap on purchases over several years. GM can buy up to that amount, and it can choose to spend less.
GM's report gave investors mixed news. GM raised its expected cash. It also set its headline profit forecast, the main figure most analysts track, below their estimates. On October 20, investors gave the profit forecast more weight when they set the share price.
Netflix showed the same pattern
Netflix reported its third-quarter results on October 20. That gave investors a second example. Netflix reported diluted EPS of $0.87, above the $0.82 it had forecast. Diluted EPS divides profit by all the shares that could exist. That count includes shares that could come from stock options. Stock options are rights to buy shares at a set price. Netflix took in $12.87 billion in revenue.
Netflix shares closed the regular trading day at $68.69. After-hours trading takes place after the main session ends. In after-hours trading, investors traded the stock 4.0% lower. The drop came after Netflix gave its revenue forecast for the fourth quarter.
Two companies beat a profit number on the same day. Both stocks fell after investors weighed the forecast for the period ahead.
A test for the next report
Reporters lead earnings headlines with "beat" or "miss." A miss is a result below the consensus. That label covers the past quarter, measured against estimates. It says less about the year ahead, and investors price shares on the year ahead.
Readers can run two checks on a guidance section. For the first check, compare the midpoint of the range with the analyst consensus. On October 20, GM's midpoint was $13.25 and the consensus was $13.42. For the second check, look at both ends of the range and at the company's other forecasts. In a single report, GM lifted its floor, cut its ceiling and raised its cash-flow forecast.
On the calendar
Tesla will post its third-quarter results on Wednesday, October 21. It will hold a webcast, a live online broadcast, at 5:30 p.m. Eastern Time. Meta will release its third-quarter results after regular trading ends on October 21. It will hold a conference call at 4:30 p.m. ET. On a conference call, company executives discuss results with analysts. Readers can apply the same two checks to both. Start with the quarter, and move on to any forecast for the months ahead.
Stock owners can take one lesson from GM's drop on October 20. A share can fall after a good quarter. Investors move the price on the gap between a company's forecast and the estimates they had built into the price. A reader who compares the midpoint with the consensus can explain a day like that one.
Sources
Not investment advice.