
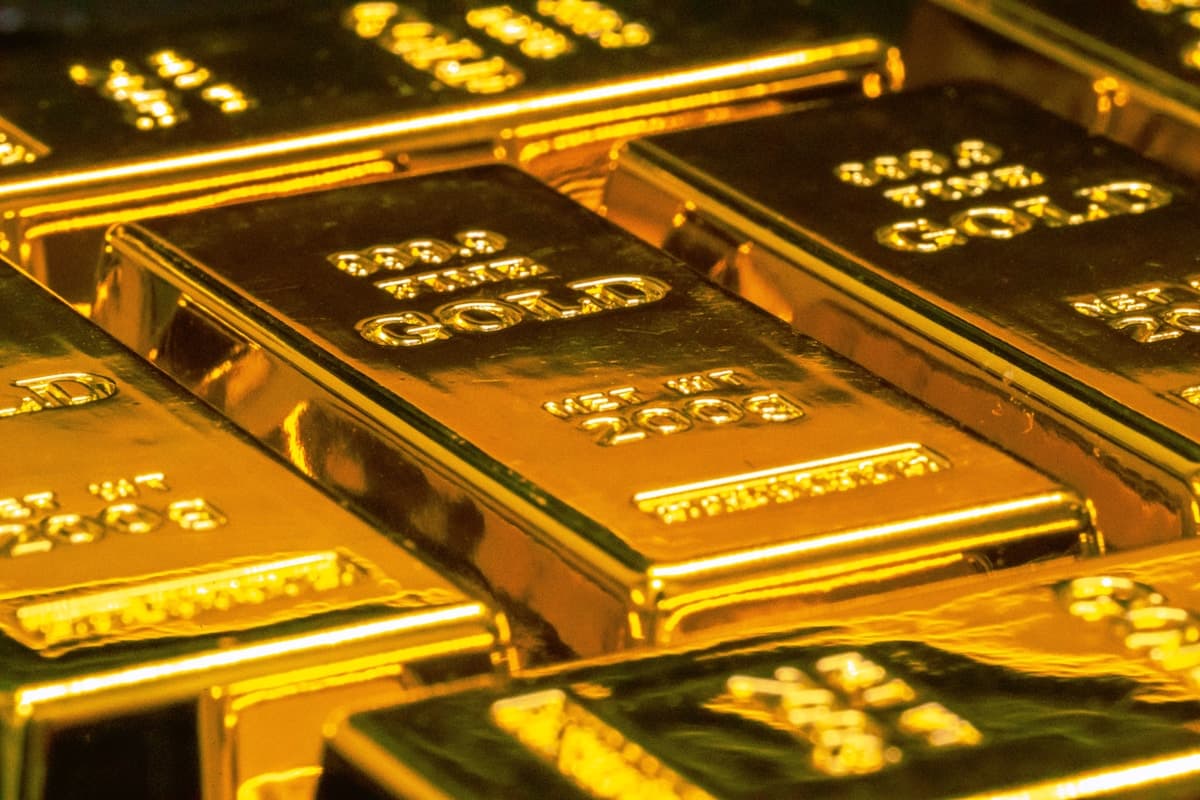
Three months ago, gold was at ₹1,91,000 per 10 grams on MCX. Everyone was calling it the ultimate safe haven. Today it trades near ₹1,52,000 — a 20% crash that wiped out two years of gains in one quarter.
March 2026 alone saw a 12% drop. That is the steepest single-month fall since June 2013.
If you bought gold at the peak, you are sitting on ₹39,000 of losses per 10 grams. If you didn't buy, you are wondering whether this is the entry point of a lifetime.
Let us look at what actually happened — and what the data says about buying gold after a crash.
What caused the 20% fall
Gold does not crash randomly. Six things hit it at once.
1. The US dollar got stronger
When the dollar strengthens, gold (priced in USD globally) becomes more expensive for foreign buyers. Demand drops. The Dollar Index climbed sharply through Q1 2026, driven by hawkish Fed language and rising Treasury yields.
2. US bond yields rose
The 10-year Treasury yield climbed above 4.5%. Gold pays no interest. When risk-free bonds offer more, money moves out of gold and into bonds. This is the single biggest competitor gold has.
3. Oil crossed $100 and inflation spiked
Brent crude hit $100 per barrel — with an intraday spike to $140 during US-Iran tensions in late February. US CPI for March 2026 came in at 3.3% year-on-year, up from 2.4% in February. Energy costs surged 12.5%, with gasoline up 18.9% and fuel oil up 44.2%.
You would expect inflation to help gold. It did not this time. Why? Because higher inflation forced the Fed to keep rates elevated, which strengthened the dollar and bond yields — both gold-negative.
4. ETF investors dumped holdings
SPDR Gold Trust — the world's largest gold ETF — saw its holdings drop to 959.24 tonnes by April 10. Global gold ETFs saw roughly $14 billion in outflows during Q1 2026. Institutional money was leaving.
5. Central bank buying slowed
In 2024 and 2025, central banks were the biggest gold buyers globally — over 1,000 tonnes per year. That buying slowed sharply in early 2026 as geopolitical alignments shifted and several central banks hit their allocation targets.
6. Panic selling and margin calls
As gold fell past key technical levels (₹1,70,000, then ₹1,60,000), leveraged traders on MCX faced margin calls. Forced liquidation accelerated the decline — a classic sell spiral.
How bad is this historically?
A 20% drop sounds dramatic, but gold has done this before.
- 2013: Gold fell 28% in the year after the "taper tantrum" — the Fed's first hint at reducing quantitative easing. It took until 2020 to reclaim those highs.
- 2008: Gold dropped 30% during the financial crisis before rallying 170% over the next three years.
- 2020: A brief 14% drop during the March COVID crash, recovered within four months.
The pattern: gold crashes when liquidity tightens or the dollar surges. It recovers when those conditions reverse.
India-specific factors
India's relationship with gold is different from the rest of the world.
Indian households own between 25,000 and 50,000 tonnes of gold — worth somewhere between $2.4 trillion and $10 trillion depending on whose estimate you use. That is more gold than the top 10 central banks combined. (Source: World Gold Council, Assocham, Morgan Stanley, UBS)
RBI holds 880.3 tonnes — making India the 8th largest official gold holder globally. The central bank has been steadily adding to reserves.
Gold loans in India crossed ₹24.34 lakh crore (roughly $26 billion) in the first eight months of FY26 alone. When gold prices fall, the collateral value of these loans drops — which means banks issue margin calls to borrowers. That creates real economic pressure beyond just investment portfolios.
Should you buy gold now?
There is no clean answer. But here are three frameworks.
Framework 1: Allocation-based (most sensible)
If your target gold allocation is 10-15% of your portfolio and it has dropped below that because of the crash, you rebalance by buying. If it is still within range, you wait. This removes emotion entirely.
Framework 2: Cost-averaging
If you want gold exposure, buy in three to four tranches spread over the next two to three months. You will not catch the exact bottom, but you will avoid buying the exact top.
Framework 3: Wait for reversal signals
If you want confirmation, wait for the Dollar Index to peak and reverse, or for the Fed to signal rate cuts. Historically, gold's strongest rallies began one to two months after the dollar peaked.
What NOT to do
- Do not buy gold because "it always goes up." It does not. It went nowhere from 2013 to 2019.
- Do not panic-sell physical gold you bought for family events. That gold was never an investment — it is cultural, and selling it at a loss makes no financial sense.
- Do not leverage into gold futures hoping for a bounce. Leveraged positions during volatile corrections get wiped out.
- Do not compare this to Bitcoin. Gold and crypto have different demand drivers, different holders, and different risk profiles.
The bottom line
Gold is down 20% from its all-time high. The last time a correction this sharp happened (2013), it took seven years to recover. The time before that (2008), it recovered in three years and then tripled.
The difference between 2013 and 2008? In 2008, central banks started easing within months. In 2013, they tightened. Where rates go next will determine whether this is a generational buying opportunity or just the first leg down.
Watch the Fed. Watch the dollar. Buy slowly if you buy at all.
Data sources: MCX, Reuters, World Gold Council, SPDR Gold Trust, AMFI, RBI, Assocham, US Bureau of Labor Statistics. Prices as of April 14, 2026.
Follow While25 for data-driven market analysis — built for Indian traders and investors.