
The 10-year Treasury yield closed at 5.293% on September 30, its highest level since June 2007. On the same day, a softer inflation report pushed traders toward a Fed pause. August core PCE rose 3% from a year earlier against a 3.3% forecast, and the CME FedWatch tool moved to a 65.1% chance that the Fed holds in October, up from even odds the day before. Less expected tightening and a higher long yield can only coexist through one mechanism, and it has a name.
Every 10-year yield hides two numbers
Economists split the 10-year yield into two parts. The first is the average short-term rate the market expects over the next decade, which is what you would earn by rolling Treasury bills for ten years. The second is the term premium: the extra yield investors want for locking money into one long bond when they could roll short ones.
The Adrian-Crump-Moench model, known as ACM, writes this as a sum. The 10-year yield is about equal to the expected short-rate path plus the term premium. Neither part trades on a screen. The model estimates both from the shape of the yield curve, so the premium gets quoted with a lag. As of August 31, 2026, the ACM 10-year term premium stood at 0.70%.
September 30 moved the second part
Run the PCE day through that sum. Headline PCE rose 3.4% year over year against 3.7% expected, and core came in at 3% against 3.3%. Traders cut their odds of an October hike, which pulls down the front of the expected rate path.
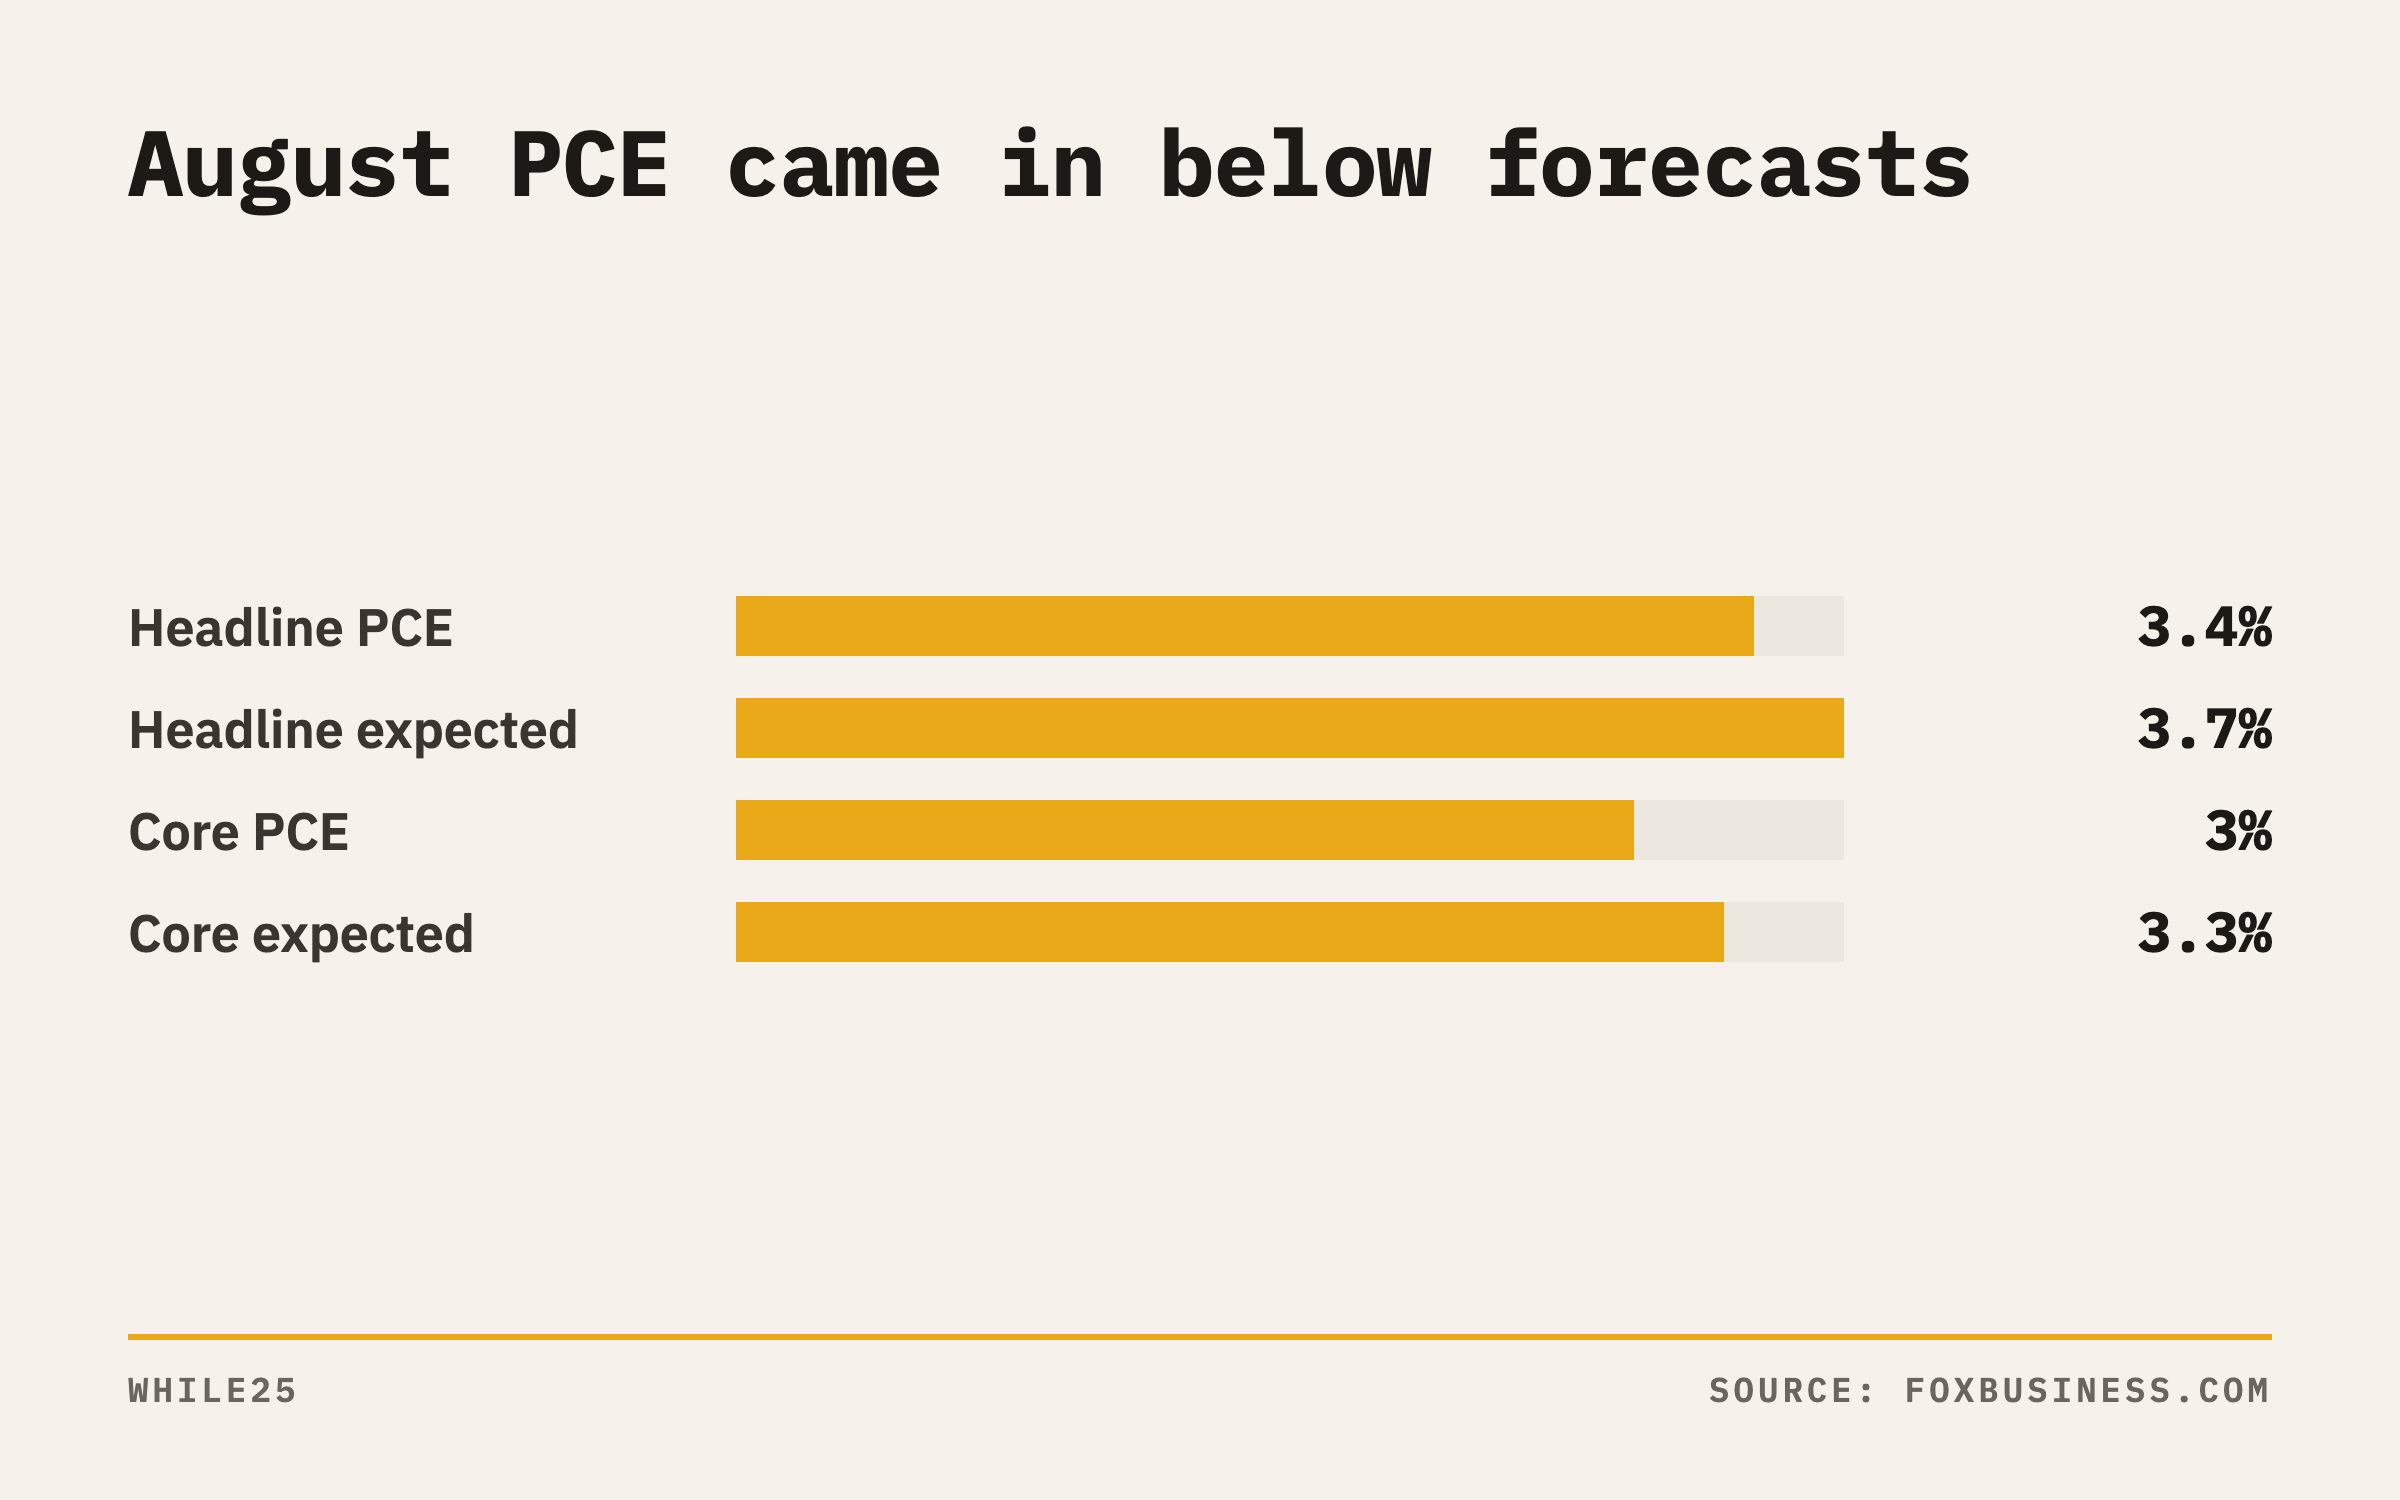 Bar chart comparing August PCE inflation with forecasts: headline 3.4% vs 3.7% expected, core 3% vs 3.3% expected
The 10-year still rose 3.8 basis points on the day to 5.293%. The 30-year touched 5.6206%, its highest since June 2002. If the expected path eased and the total rose, the term premium did the lifting.
One caveat keeps this honest. Other reports released on September 30 suggested the economy ran stronger in the spring than first estimated, and that can lift expectations for rates in later years. The split still holds in broad terms: the front of the curve reacted to inflation data, and the long end priced something else.
The move has built over weeks. The 10-year is up 17.9 basis points over five sessions and 53.5 basis points over one month, after closing at 5.24% on September 28.
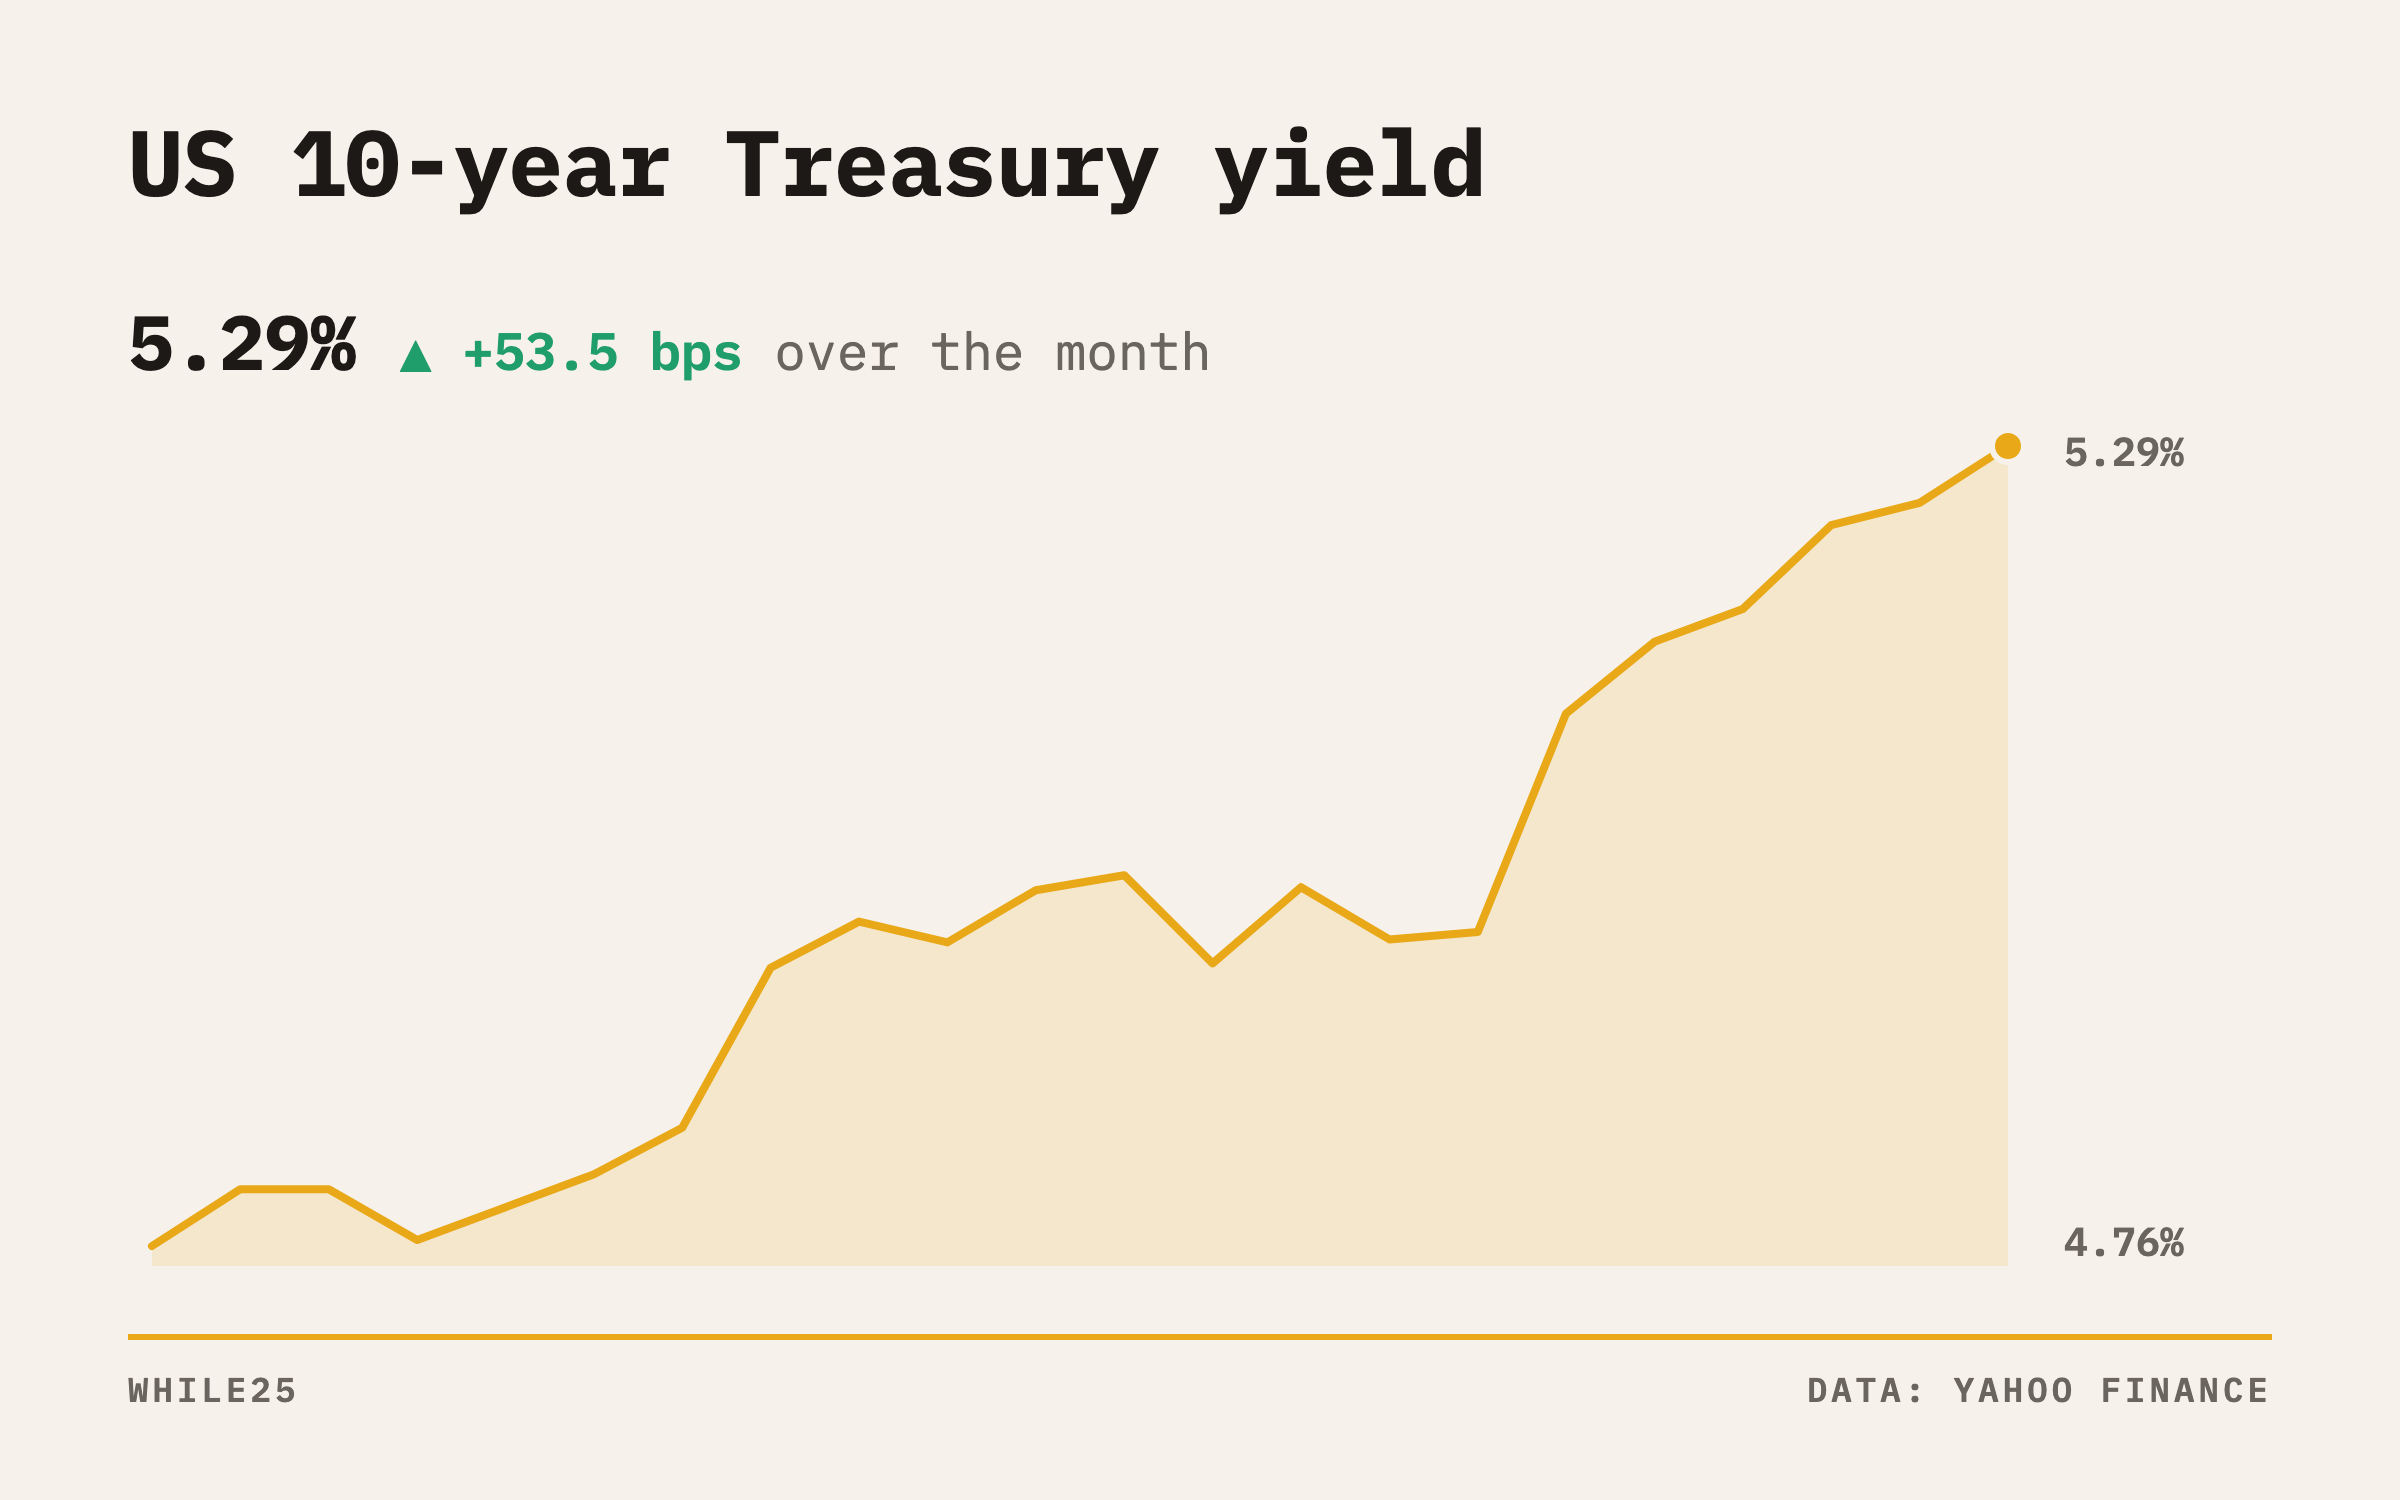 Line chart of the US 10-year Treasury yield over the past month, climbing to its highest close since 2007
Why the premium sat below zero for most of 2016 to 2024
A negative term premium sounds backwards. It means investors accepted less yield on a 10-year bond than they expected to earn by rolling bills. The ACM estimate was mostly negative from 2016 through 2024, and it set a daily record low of -1.65% on March 9, 2020, during the pandemic crash.
Three supports held it there. Central banks bought long bonds in size through quantitative easing, which pulled duration out of private hands. Inflation stayed low and stable, so the risk of a surprise eating into a fixed coupon looked small. And Treasuries tended to rally when stocks fell, which made long bonds a crash hedge. Investors will accept a lower yield on an asset that pays off when the rest of the portfolio bleeds.
The first sustained positive readings arrived in October 2024. Each support has since weakened. The Fed is raising rates, a setting with no room for bond buying of the QE kind. Inflation is running well above target at 3.4% on the headline PCE measure. And on September 30, bonds and stocks fell together, with the Dow down 0.86% as yields rose. A bond that no longer hedges equity losses has to pay its holder more.
The drivers being cited this time
Market commentary on the selloff names four causes: expected Fed hikes, an energy crisis kicked off by the war in Iran, ballooning US government debt and budget deficits, and a historic investment cycle driven by the AI build-out. Only the first sits on the expected-rate side of the sum. The other three feed the premium.
Energy
An oil shock widens the range of possible inflation outcomes. A 10-year bond holder is exposed to that whole range, so the compensation for bearing it rises. WTI crude closed at $90.34 on September 30, up 1.07% on the day.
Deficits and issuance
Larger deficits mean the Treasury sells more long bonds, and each extra bond needs a buyer at some price. A recent auction drew its weakest bid-to-cover ratio in a year. Bid-to-cover is the dollar value of bids received for each dollar of debt offered; a lower ratio means thinner demand, and the clearing yield has to rise to find it.
AI capex borrowing
Companies building data centers raise part of the money in the bond market. That borrowing competes with Treasuries for the same pool of long-term savings: pension funds, insurers and foreign reserve managers. When private issuers want duration funding at the same time as the government, the price of duration goes up.
How the premium reprices long-duration stocks
Duration applies to equities too. A company whose cash flows arrive far in the future behaves like a long bond, because its present value depends more on the discount rate. Equity discount rates start from the long Treasury yield, so a rise in the term premium passes through to them even when the Fed outlook softens.
Small caps sit near the top of that exposure. The Russell 2000 fell 0.39% on September 30 and is down 4.22% over the month. Many small companies carry floating-rate or short-dated debt that must be refinanced at current yields, and more of their value rests on growth that has yet to show up in earnings.
Unprofitable tech sits higher still. A company with no earnings today has all of its value in later years, which gives it the longest duration in the equity market. The Nasdaq Composite is up 2.92% over the month, but that index return says little about its unprofitable tail, because the weight sits with megacaps that generate large cash flows now.
What this means for your book
A drop in hike odds no longer delivers a bond rally by default, and a softer inflation print no longer delivers relief for rate-sensitive stocks by default. When the long end moves against the front end, the term premium is doing the work, and it answers to oil, auction demand and deficit headlines as much as to the Fed.
The scheduled tests are close. The September jobs report lands on October 2 at 8:30 a.m. ET, the minutes of the September FOMC meeting follow on October 7, and the Fed announces its next decision on October 28. If you hold small caps or unprofitable growth, you already carry term premium exposure, whether or not a single bond sits in the account.
Sources
- eco3min.fr
- ajupress.com
- 247wallst.com
- foxbusiness.com
- ca.finance.yahoo.com
- bls.gov
- federalreserve.gov
Not investment advice.