
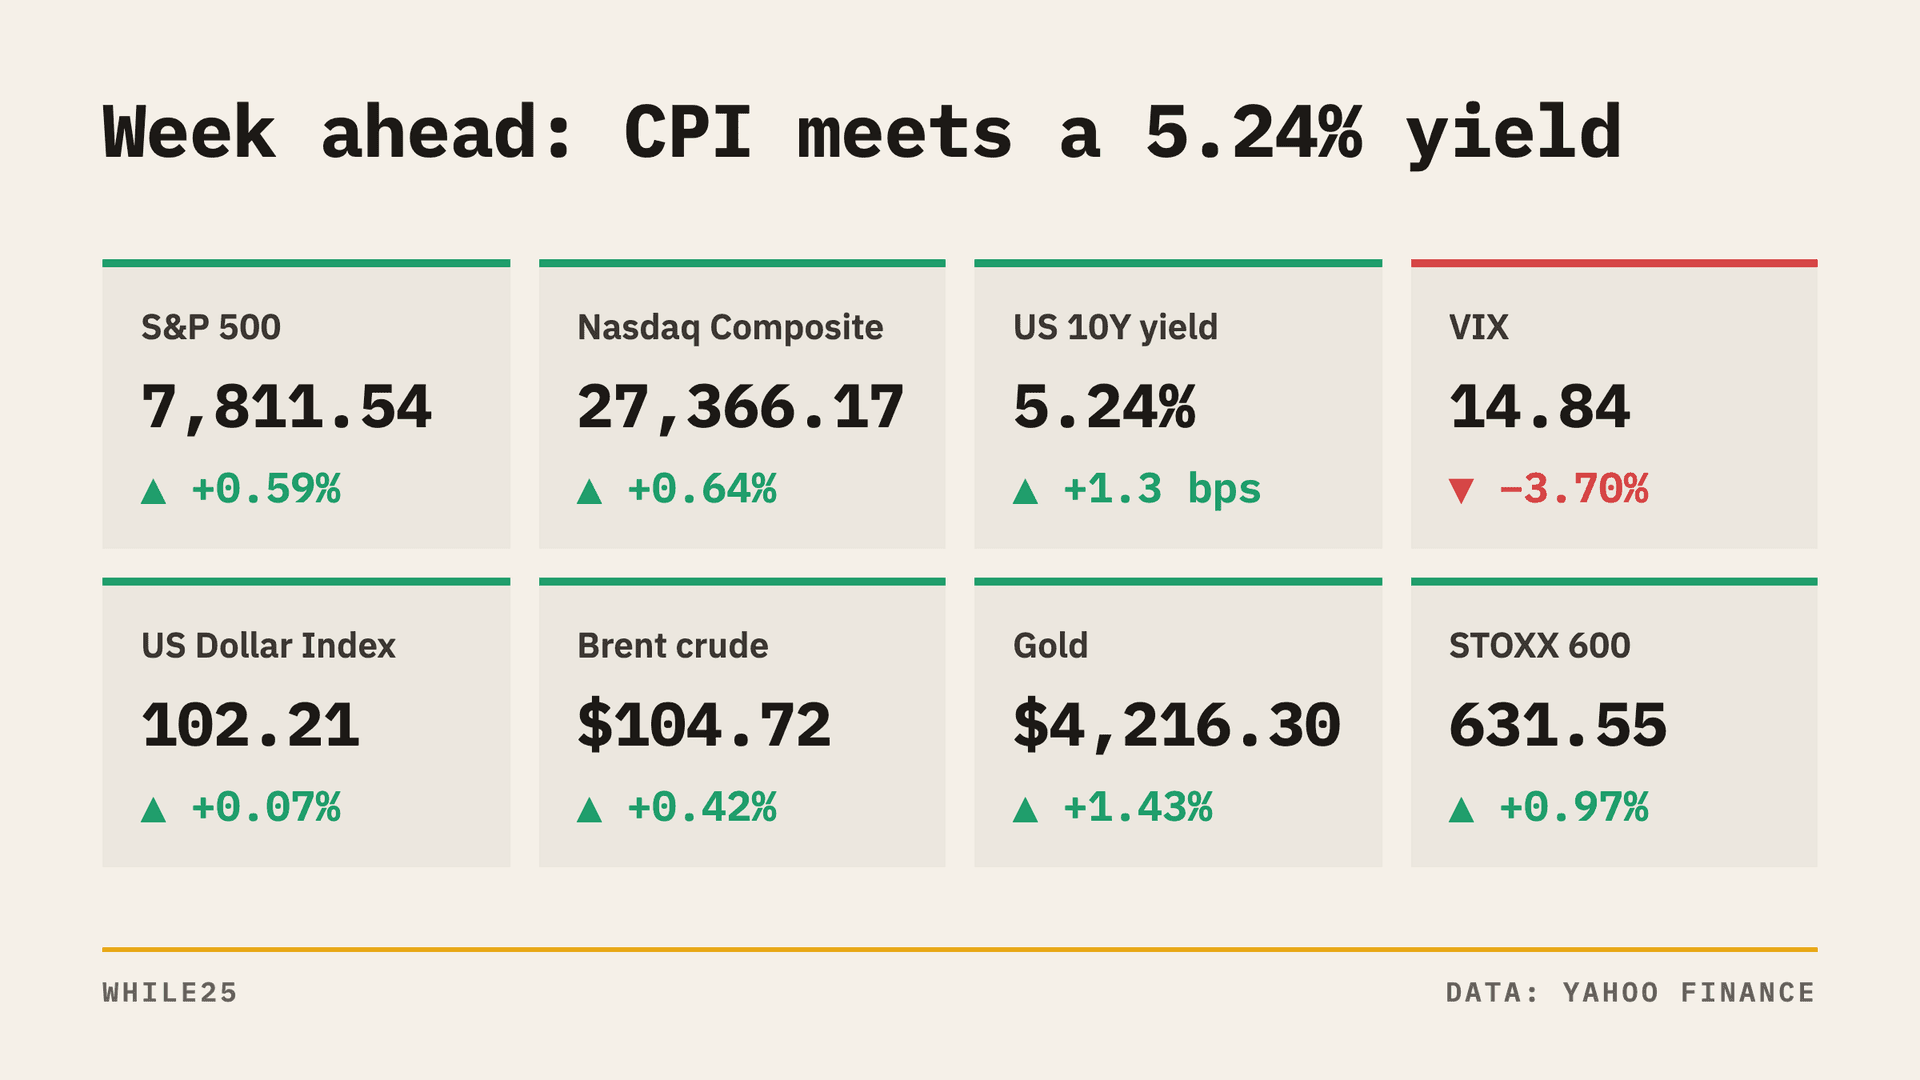
A 10-year Treasury is a bond, a loan that investors make to the US government for 10 years. Its yield is the interest rate the government pays on that loan. The 10-year Treasury yield closed at 5.244% on October 9. On Wednesday, October 14, the Bureau of Labor Statistics, a US government agency, publishes September consumer prices. Inflation is the pace at which prices rise. Economists expect prices 3.6% higher than in September last year. The previous reading was 3.4%.
The same week, the largest US banks open the third-quarter earnings season. In earnings season, public companies report their quarterly profits. The third quarter runs from July to September. The S&P 500 is an index, a single number that tracks the share prices of 500 large US companies. It starts the week at 7,811.54. Investors will weigh an inflation report against company profits. The Federal Reserve, the US central bank, holds its next meeting on October 27 to 28.
Yields rose for a month and eased last week
The 10-year yield rose 40.7 basis points over the past month. Bond traders measure yields in basis points. 100 basis points make one percentage point. On Wednesday, October 7, the yield touched close to 5.37%. That was its highest level in 24 years. The yield eased later in the week. It finished the five trading days 3.3 basis points lower.
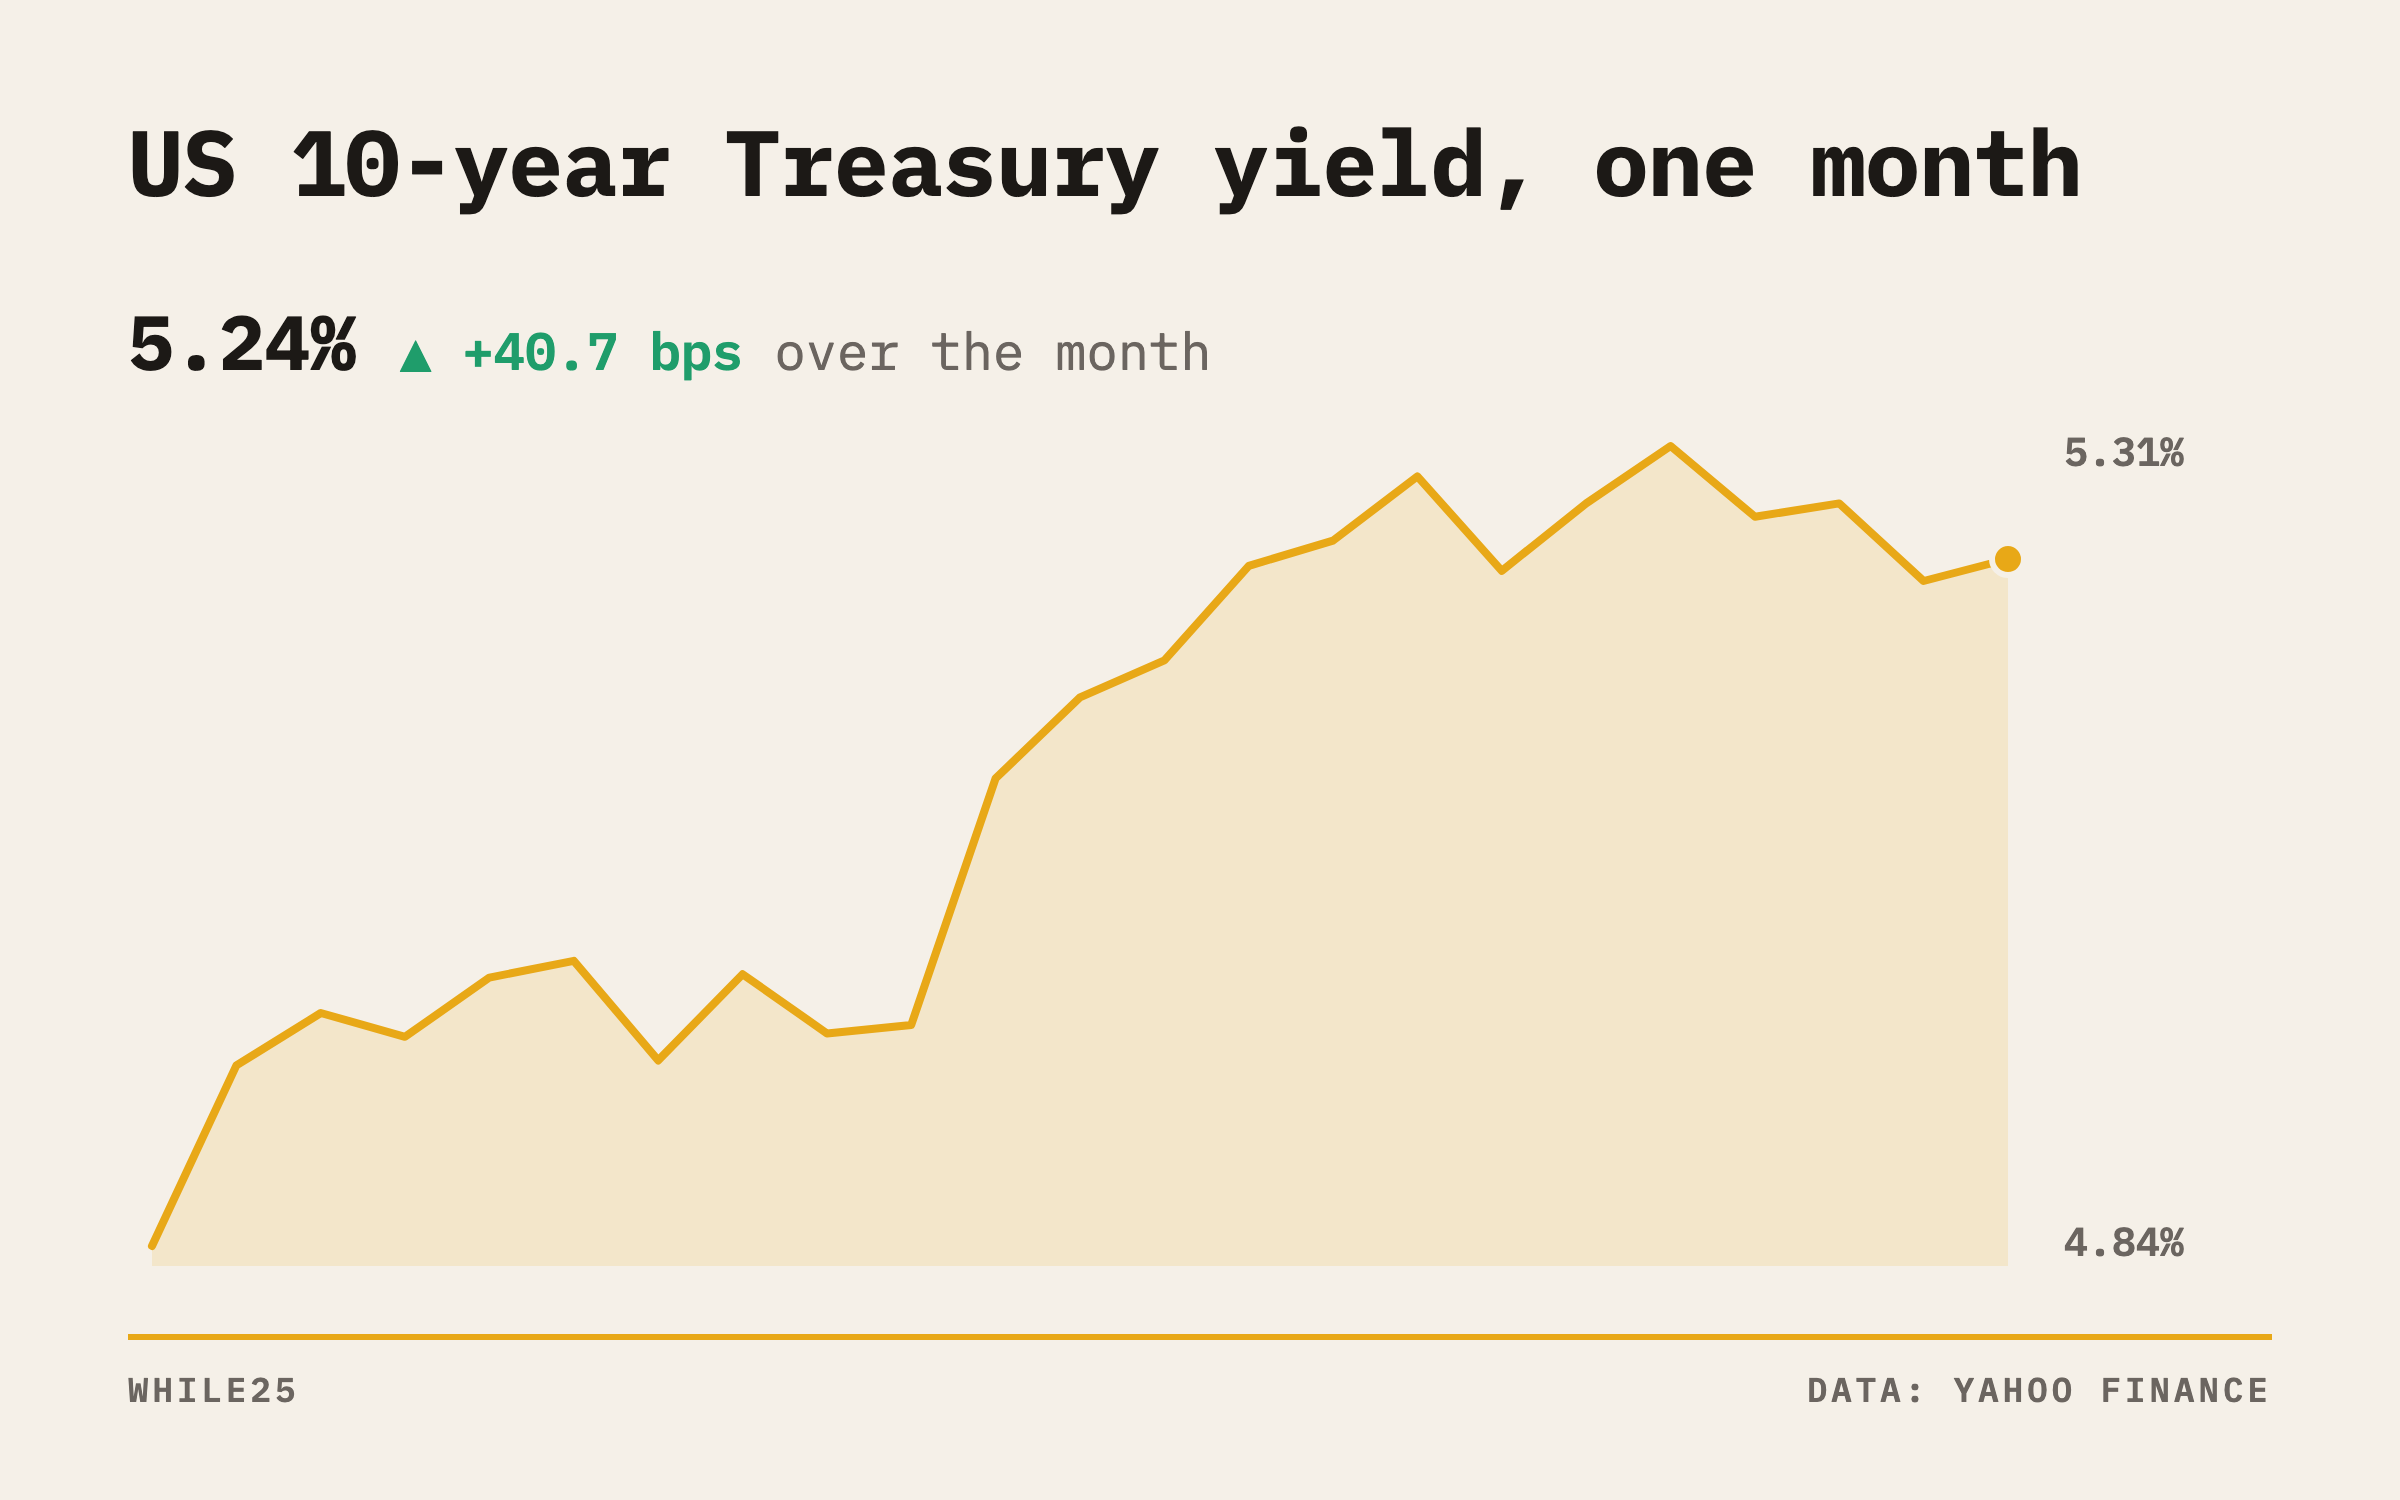 Line chart of the US 10-year Treasury yield over one month, ending at 5.244%
Stock buyers watch this yield. A higher yield means a safe government bond pays more. Investors compare stock prices with that safer payout.
Large-company stocks rose over the week. The S&P 500 gained 1.2%. The Dow, another index of big US companies, gained 0.9%. The Nasdaq, an index heavy in technology companies, added 0.6%. That was its fourth weekly gain in a row. The VIX, a gauge of how much traders expect stocks to swing, fell to 14.84. The Russell 2000, an index of small companies, slipped 0.91% over the five trading days.
Wednesday's inflation report
The consumer price index, or CPI, is a measure of the prices households pay for a set list of goods and services. The Bureau of Labor Statistics releases the September report at 8:30 a.m. ET on October 14. Economists expect prices up 0.6% for the month. Prices rose 0.4% the month before.
Core CPI is the same measure without food and energy. Food and energy prices jump around from month to month. Economists forecast core prices up 0.2% for the month and 2.5% for the year. The previous readings were 0.3% and 2.4%. Headline CPI is the full measure, with food and energy included. Economists' headline forecasts sit above their core forecasts. The difference comes from food and energy.
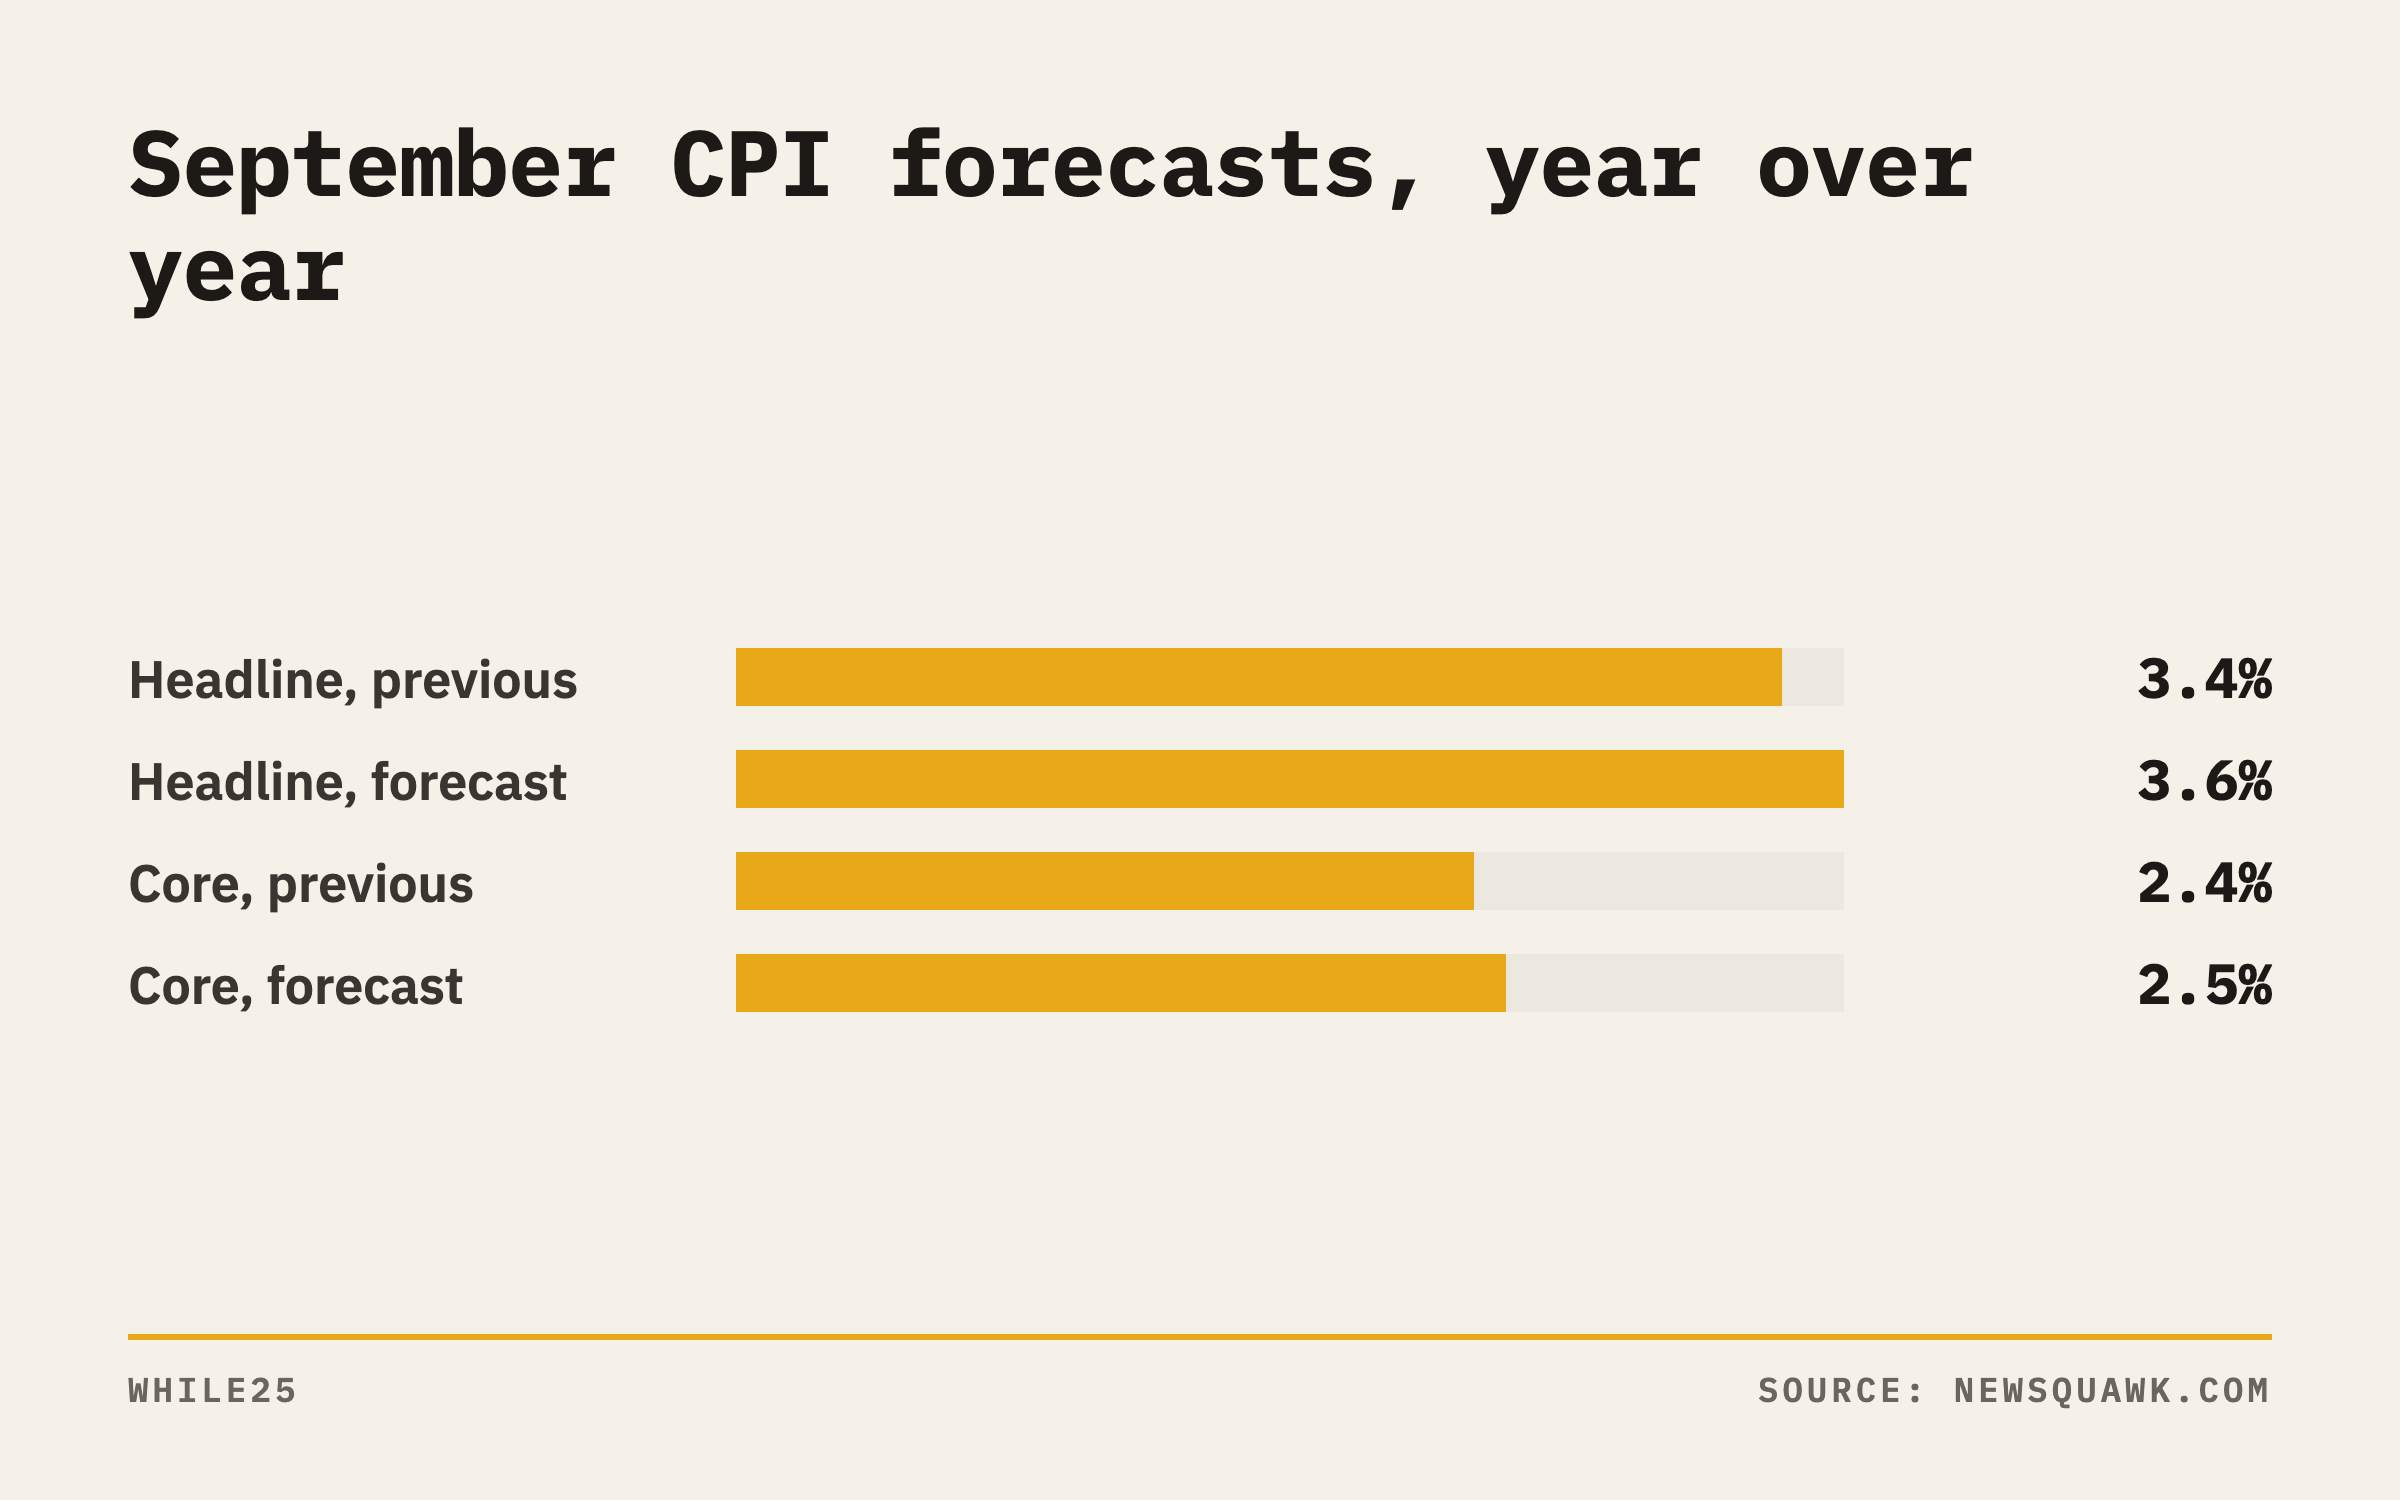 Bar chart of CPI forecasts: headline inflation expected at 3.6% against 3.4% previously, core at 2.5% against 2.4%
The Fed raised its target range by 25 basis points in September, to 3.75% to 4.00%. The range is the Fed's goal for the rate banks charge each other on overnight loans. The Fed's rate-setting committee meets on October 27 to 28. At 2:00 p.m. on October 14, the Fed publishes its Beige Book. The Beige Book is a summary of reports that businesses give the Fed's regional banks about local conditions.
On Thursday, October 15, US officials publish September producer prices. Producer prices are the prices businesses get for their goods. Officials release retail sales and weekly jobless claims in the same 8:30 a.m. ET slot. Retail sales are the total that stores sell. Jobless claims are new applications for unemployment benefits. Economists forecast retail sales up 0.3% for the month, after 1.1% the month before.
On Friday, October 16, officials publish import prices at 8:30 a.m. Import prices are the prices of goods brought into the US. Officials publish industrial production at 9:15 a.m. Industrial production is the output of US factories, mines and utilities. Fed Chair Warsh, the head of the central bank, is due to speak the same day.
Diesel sits behind the headline number
Fuel is one reason the headline and core forecasts differ. According to AAA, US pump diesel hit a record $6.53 a gallon on September 22. The pump price is the price drivers pay at the fuel station. On October 9, pump diesel averaged close to $6.28. On the same date last year, it averaged close to $3.68.
That same day, President Trump announced a deal with Vladimir Putin. Under the deal, Russia will supply diesel to US and global markets. The US Treasury, the government's finance department, followed with General License 135. The license is a government permit. Under it, companies may sell, deliver and import Russian diesel until April 7, 2027. A 2022 law ending imports of Russian oil stays in force. In his post, Trump described up to 4.8 million tonnes of diesel in total.
Wholesale diesel is fuel that companies sell to each other in bulk. The Financial Times reported that the New York Harbor wholesale price fell around 4.5% to $4.67 a gallon on the news. Trump announced the deal after September ended. The October 14 CPI report covers September, the month of the record pump price.
Brent crude oil sets the main global reference price for oil. It closed at $104.72 a barrel. WTI sets the main US reference price. It closed at $91.85.
Banks open the earnings season
JPMorgan Chase, Goldman Sachs, Citigroup and Wells Fargo report on Tuesday, October 13. Johnson & Johnson and UnitedHealth report the same day. A share is one small unit of ownership in a company. Earnings per share is a company's profit divided by its number of shares. Analysts, the people who study companies and forecast their results, estimate JPMorgan's earnings per share at $5.93.
Bank of America, Morgan Stanley, BlackRock and ASML report on Wednesday, October 14, before the stock market opens. Chipmaker TSMC posts full third-quarter results on Thursday, October 15.
According to FactSet, analysts expect S&P 500 earnings per share up 29.5% from the same quarter last year. The figure for the second quarter was 26.7%. For financial companies, analysts forecast 3.0%. The banks are among the first to report. Their group has a 3.0% forecast, against 29.5% for the index as a whole.
Treasury bills, or bills, are short-term loans to the US government. On October 13, the Treasury sells 6-week, 13-week and 26-week bills. The US bond market closes on Monday, October 12, for Columbus Day. Stock exchanges stay open.
Europe and Asia
Europe's STOXX 600, an index of 600 European companies, ended at 631.55. It rose 0.03% over the five trading days. Germany's main stock index, the DAX, closed at 25,087.27. It fell 0.57% over the same stretch. UK officials publish August GDP on Thursday, October 15. GDP, or gross domestic product, is the total value of what an economy produces. Forecasters expect a monthly fall of 0.3% or 0.4%.
Japan's main stock index, the Nikkei 225, closed at 69,030.92. Korea's main index, the KOSPI, fell 3.10% over the five trading days. China's Shanghai Composite index lost 1.92%.
Chinese officials release September consumer and producer prices on Wednesday, October 14. Forecasters see consumer inflation at 0.9% to 1.0%, up from 0.8%. They see producer prices at 3.8%, unchanged from the last reading. Australia's central bank, the RBA, publishes the written record of its September meeting on Tuesday. At that meeting, the RBA raised its cash rate by 25 basis points to 4.60%. The cash rate is its main interest rate. Australian officials release September jobs data on Thursday.
The IMF and the World Bank are global lenders to governments. They hold their annual meetings in Bangkok from October 12 to 18. At 9:00 a.m. Bangkok time on October 13, the IMF publishes its World Economic Outlook. In that report, the IMF gives its forecasts for global growth.
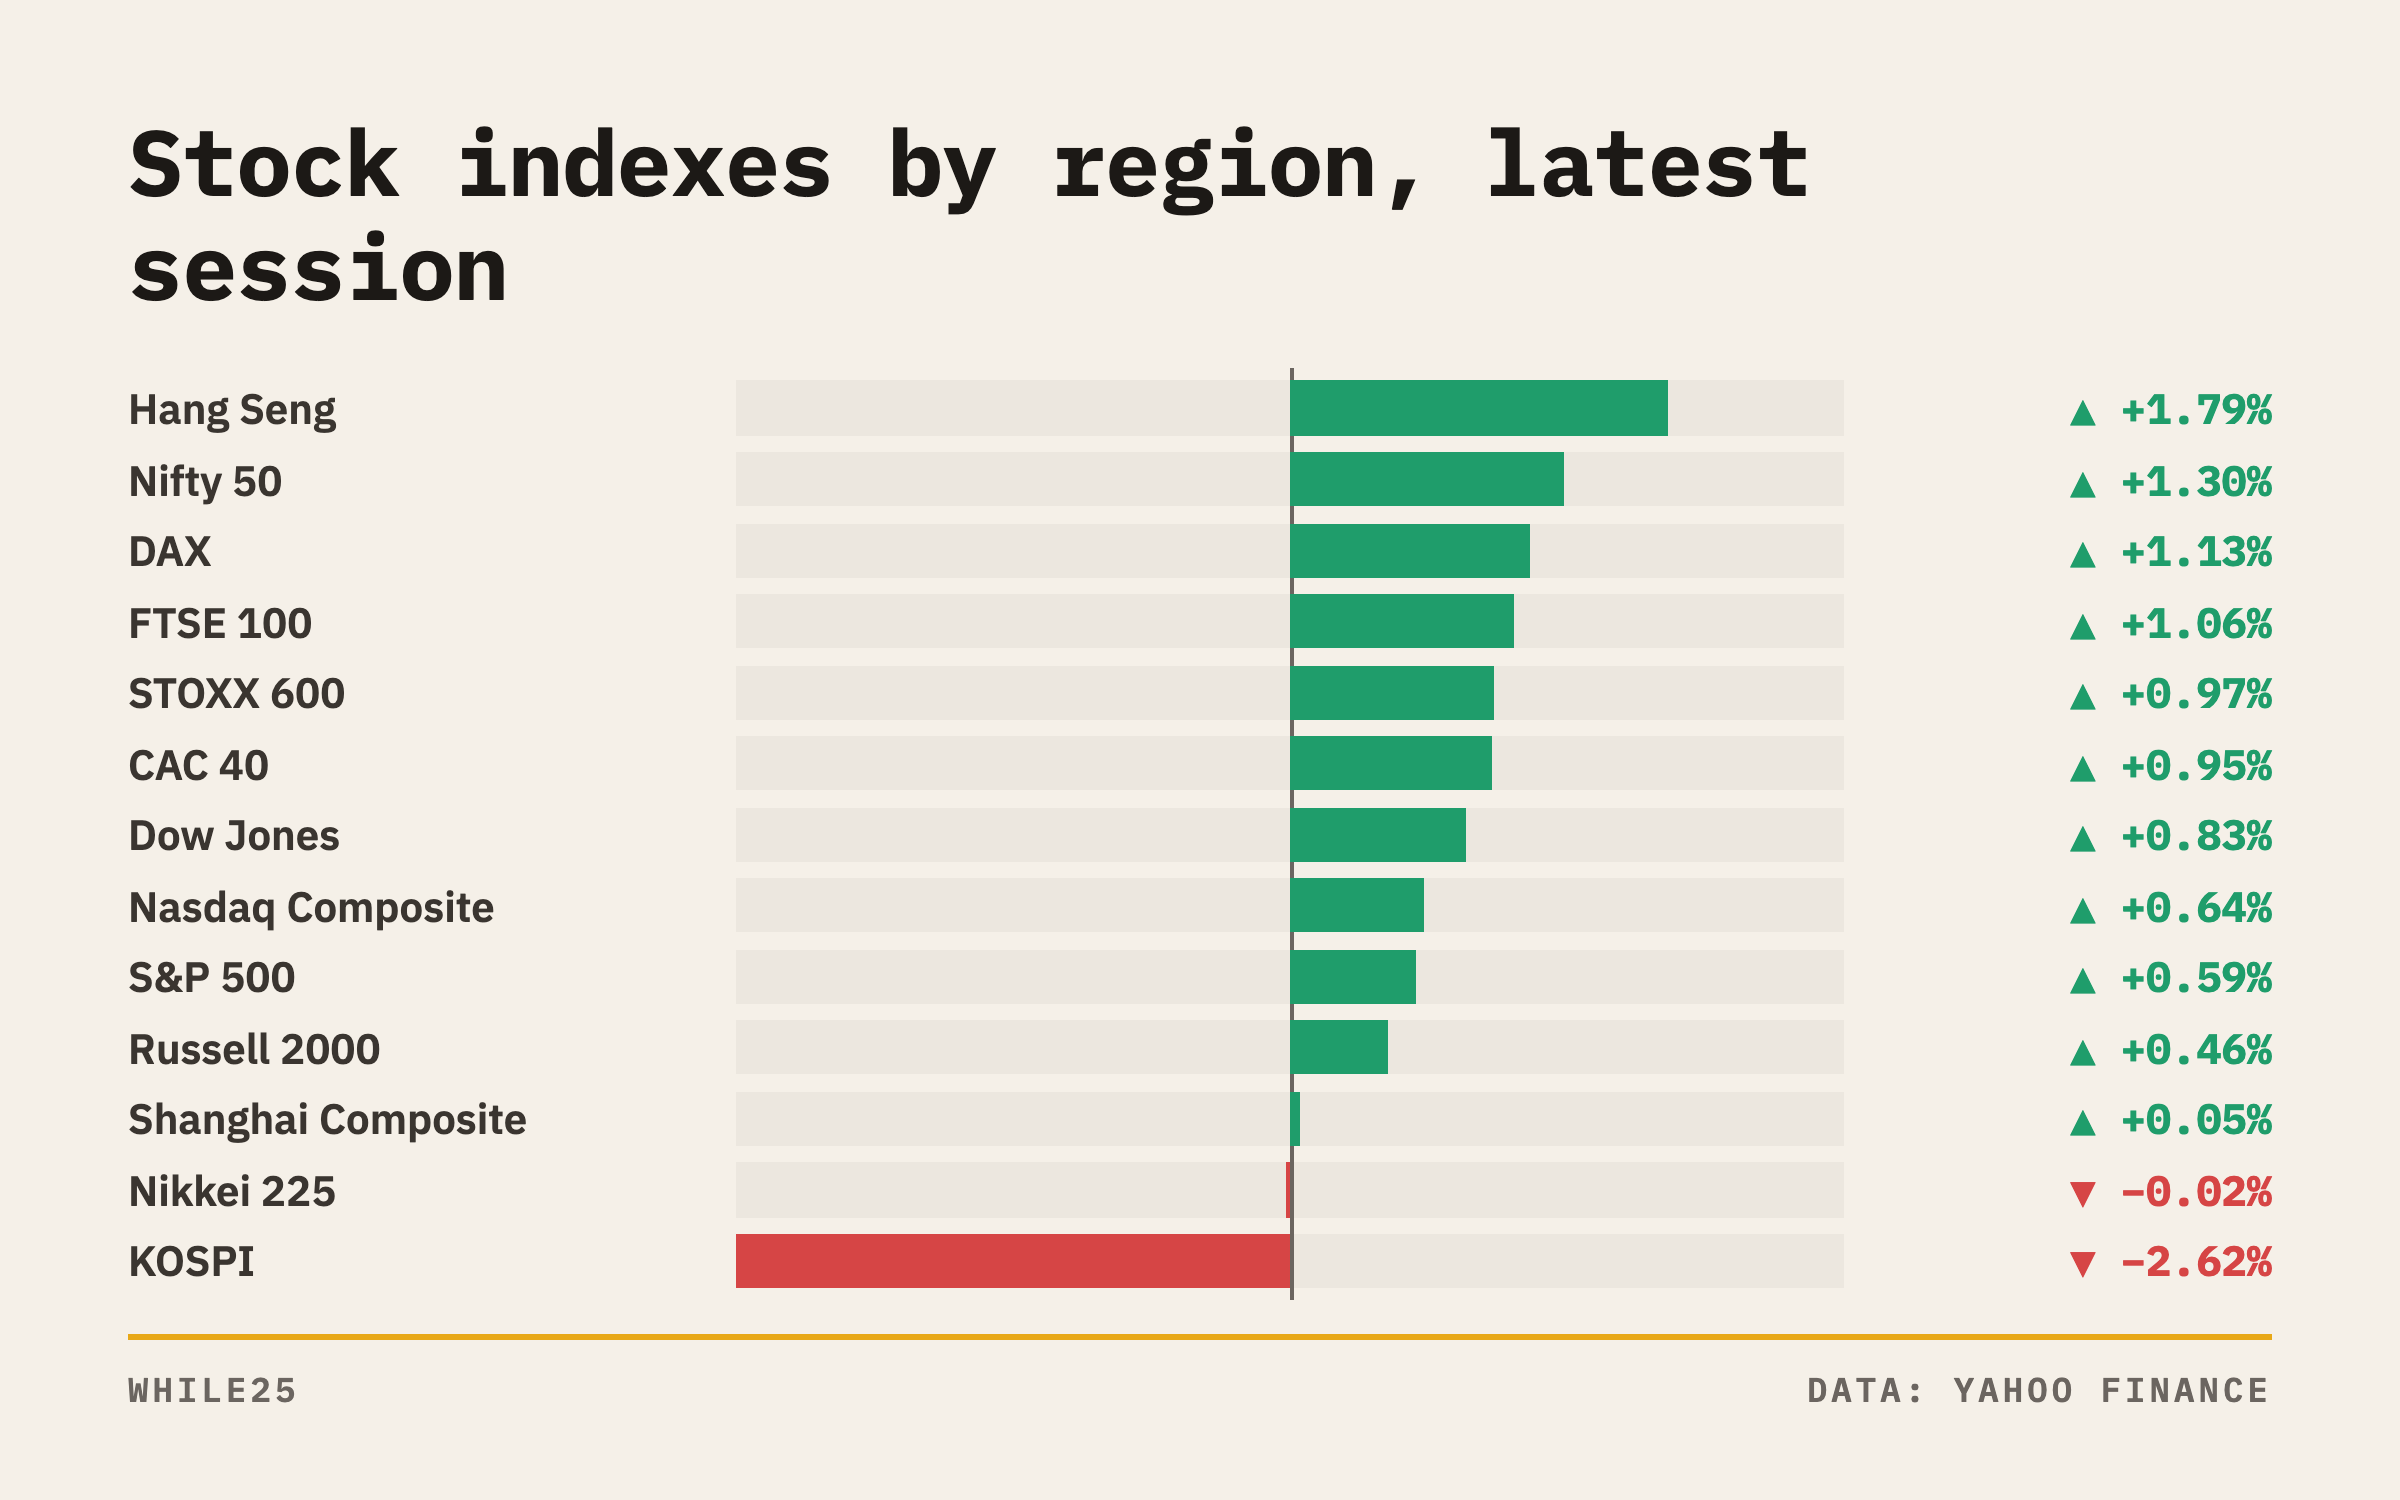 Bar chart of the latest day changes for major stock indexes in the US, Europe and Asia
Currencies, gold and bitcoin
The US Dollar Index stood at 102.21. The index is a measure of the dollar against a group of major currencies. One euro bought 1.1196 dollars. One dollar bought 158.255 yen. Gold rose 1.43% on October 9 to $4,216.30 an ounce. Bitcoin, a digital currency, traded at $83,424.83. It fell 2.49% over the five trading days.
The week on one page
- Monday, October 12: US bond market closed for Columbus Day. Stock exchanges open. IMF and World Bank meetings begin in Bangkok.
- Tuesday, October 13: IMF World Economic Outlook. Earnings from JPMorgan Chase, Goldman Sachs, Citigroup, Wells Fargo, Johnson & Johnson and UnitedHealth. Treasury bill sales. RBA meeting record.
- Wednesday, October 14: US CPI at 8:30 a.m. ET. Fed Beige Book at 2:00 p.m. Earnings from Bank of America, Morgan Stanley, BlackRock and ASML. China consumer and producer prices.
- Thursday, October 15: US producer prices, retail sales and jobless claims at 8:30 a.m. ET. TSMC results. UK August GDP. Australian jobs.
- Friday, October 16: US import prices at 8:30 a.m. ET and industrial production at 9:15 a.m. Fed Chair Warsh speaks.
Reading the week for your portfolio
A portfolio is the set of investments a person holds. Investors get two reports to read this week: CPI and bank earnings. CPI shows how fast prices rise. The Fed will weigh it at its October 27 to 28 meeting. Bond investors use it to set the 10-year yield.
Banks will report how their borrowers held up through the quarter. They will report the same for their dealmakers. Dealmakers are the staff who arrange company mergers and share sales.
Investors have priced the S&P 500 at 7,811.54 based on the profit growth they expect. They weigh those profits against the 10-year yield. Investors who follow both reports get a fuller picture of this week's moves.
Sources
- finance.yahoo.com
- newsquawk.com
- tradingkey.com
- imf.org
- newsquawk.com
- fxempire.com
- shipandbunker.com
- fortune.com
Not investment advice.